OPEN-SOURCE SCRIPT
Average Daily Liquidity
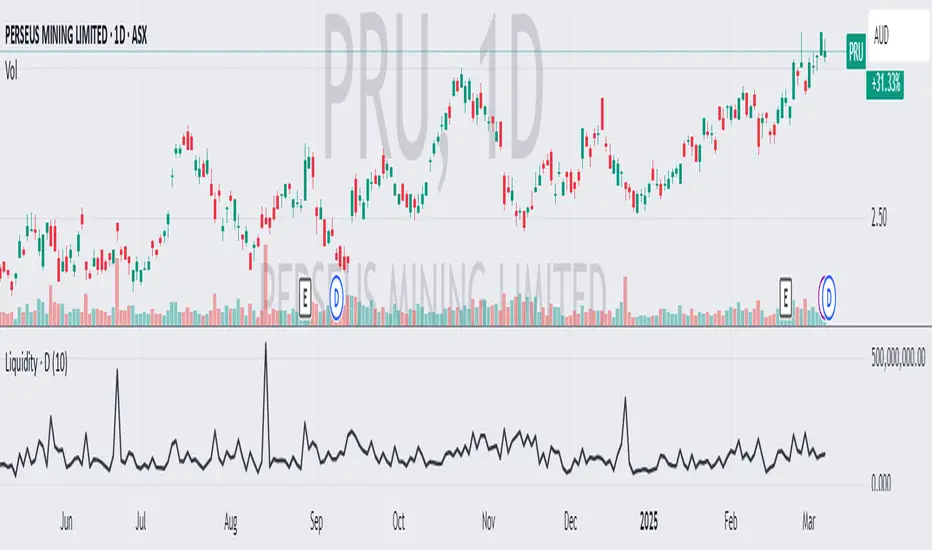
It is important to ensure sufficient stock trading liquidity so that you have sufficient volume to enter the trade and most importantly sufficient liquidity to exit the trade. Because daily trading liquidity can jump around so much by price changes and volume changes, it is important to smooth out the liquidity by using a moving average. Some use a 5 days (trading week) moving average, others use 10 day (2 weeks), 20 day ("month") and some use 65 day (quarter). The default is 10 days based upon the work of Colin Nicholson (The Aggressive Investor and Building Wealth in the Stock Market). Liquidity line changes color dependent upon the chart background luminescence. The amount you are planning to invest in a stock should have a liquidity of 10 (default) times that amount.
Open-source script
In true TradingView spirit, the creator of this script has made it open-source, so that traders can review and verify its functionality. Kudos to the author! While you can use it for free, remember that republishing the code is subject to our House Rules.
Disclaimer
The information and publications are not meant to be, and do not constitute, financial, investment, trading, or other types of advice or recommendations supplied or endorsed by TradingView. Read more in the Terms of Use.