OPEN-SOURCE SCRIPT
[CM]EMA Trend Cross STRAT
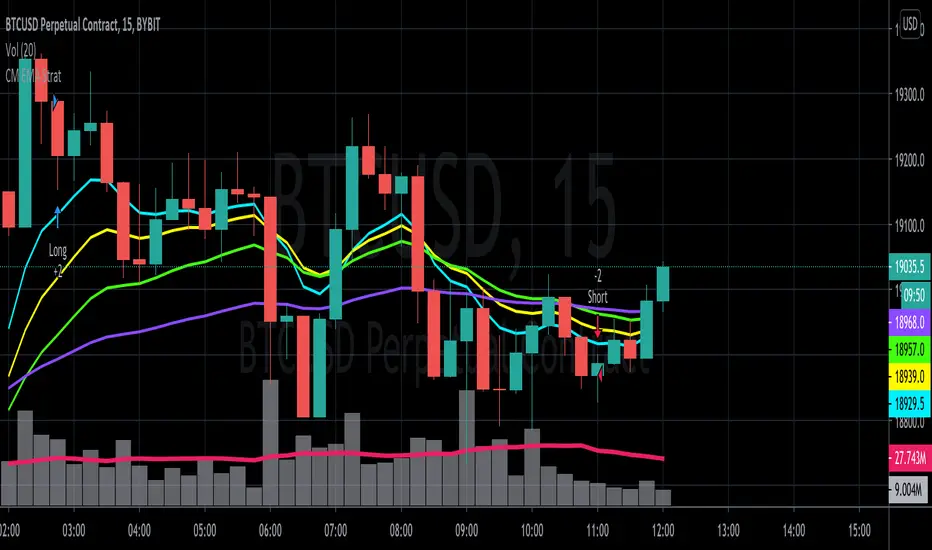
VISUALLY REPRESENTS THE CROSSING OF 8,13,21,55 EMA'S FROM KROWNS TA PROGRAM
Hello everybody! I was curious and wanted to see how the Strat described in one of the modules would look coded. So here we are, a clear cut visual representation of the methods talked about in the course from the EMA Module. Enjoy!
(Instructions)
Whenever the 8,13,21 all cross above the 55ema that constitutes a long signal.
On the flip side, whenever the 8,13,21 all cross below the 55ema that constitutes a short signal.
(Description)
This indicator shows the cross described in the TA program using the EMAS 8,13,21,55.
The Ema's are editable.(Color)
It plots the entry and exit parameters.
This allows for a more visual representation of the ideology described in the course.
This indicator also doesn't leave room for ambiguity in terms of where a cross happens.
The EMA's can be toggled to show certain ones at certain times.
The indicator can be used as a trend analysis tool.
***In terms of an exit, I find it to be better to use your own judgement, taking account the greater trend.
For example, in a bull market I would advise looking for long signals, rather than try to hop on a counter trend play. Vice Versa in a bear market. It's better for jumping in to the greater momentum.
Open-source script
In true TradingView spirit, the creator of this script has made it open-source, so that traders can review and verify its functionality. Kudos to the author! While you can use it for free, remember that republishing the code is subject to our House Rules.
Disclaimer
The information and publications are not meant to be, and do not constitute, financial, investment, trading, or other types of advice or recommendations supplied or endorsed by TradingView. Read more in the Terms of Use.