PINE LIBRARY
Updated pta_plot
Library "pta_plot"
pta_plot: This library will help you to plot different value. I will keep updating with your requirement
print_array(array_id, border_color)
Display array element as a table.
Parameters:
array_id: Id of your array.
border_color: Color for border (`color.black` is used if no argument is supplied).
Returns: Display array element in bottom of the pane.
Release Notes
v2Added:
print_array_float(array_id, border_color)
Display array element as a table.
Parameters:
array_id: Id of your array.
border_color: Color for border (`color.black` is used if no argument is supplied).
Returns: Display array element in bottom of the pane.
print_array_int(array_id, border_color)
Display array element as a table.
Parameters:
array_id: Id of your array.
border_color: Color for border (`color.black` is used if no argument is supplied).
Returns: Display array element in bottom of the pane.
Removed:
print_array(array_id, border_color)
Display array element as a table.
Release Notes
v3Added:
print_array_string(array_id, border_color)
Display array element as a table.
Parameters:
array_id: Id of your array.
border_color: Color for border (`color.black` is used if no argument is supplied).
Returns: Display array element in bottom of the pane.
Release Notes
v4Release Notes
v5Added:
print_array_bool(array_id, border_color)
Display array element as a table.
Parameters:
array_id: Id of your array.
border_color: Color for border (`color.black` is used if no argument is supplied).
Returns: Display array element in bottom of the pane.
Release Notes
v6Added:
peakprofit(longcondition, shortcondition)
peakprofit: This function will create a label for max profit in trade range.
Parameters:
longcondition: is a Boolean Value
shortcondition: is a Boolean Value
Returns: peakprofit Create Label on Chart
Instruction: Don't forget to add max_labels_count=500, max_bars_back=500
Release Notes
v7Updated:
print_array_float(array_id, position, border_color)
Display array element as a table.
Parameters:
array_id: Id of your array.
position
border_color: Color for border (`color.black` is used if no argument is supplied).
Returns: Display array element in bottom of the pane.
print_array_int(array_id, position, border_color)
Display array element as a table.
Parameters:
array_id: Id of your array.
position: Position of Table
border_color: Color for border (`color.black` is used if no argument is supplied).
Returns: Display array element in bottom of the pane.
print_array_string(array_id, position, border_color)
Display array element as a table.
Parameters:
array_id: Id of your array.
position: Position of Table
border_color: Color for border (`color.black` is used if no argument is supplied).
Returns: Display array element in bottom of the pane.
print_array_bool(array_id, position, border_color)
Display array element as a table.
Parameters:
array_id: Id of your array.
position: Position of Table
border_color: Color for border (`color.black` is used if no argument is supplied).
Returns: Display array element in bottom of the pane.
Removed:
peakprofit(longcondition, shortcondition)
peakprofit: This function will create a label for max profit in trade range.
Release Notes
v8Added:
calcCPR(High, Low, Close)
Return CPR.
Parameters:
High (float)
Low (float)
Close (float)
Returns: CPR Value as Tuple [pp, tc, bc, r1, r2, r3, r4, s1, s2, s3, s4].
Release Notes
Version 9 Updates:- `dll` function:
- Function's purpose : Plot a horizontal line and label at a specified price level on the chart.
- Parameters:
- Price (float): The Y value for the line and label.
- Text (string): The text to display alongside the label.
- Color (color): The color for the line and label text.
- Width (int, default=1): The width of the line.
- LineStyle (string, default=line.style_solid): The style of the line.
- Historical (bool, default=false): If true, the line and label will appear on historical chart data.
- Returns: Displays a horizontal line and label on the chart.
- Motive: Enhances readability and usability by providing a function for plotting customizable lines and labels on charts.
Release Notes
v10- `dll` function updated:
- Function's purpose : Plot a horizontal line and label at a specified price level on the chart.
- Parameters:
- Price (float): The Y value for the line and label.
- Text (string): The text to display alongside the label.
- Color (color): The color for the line and label text.
- Width (int, default=1): The width of the line.
- LineStyle (string, default=line.style_solid): The style of the line.
- Historical (bool, default=false): If true, the line and label will appear on historical chart data.
- Returns: Displays a horizontal line and label on the chart.
- Motive: Enhances readability and usability by providing a function for plotting customizable lines and labels on charts.
Release Notes
v11Updated:
dll(Price, Text, barCount, Color, Width, LineStyle, Historical)
Parameters:
Price (float)
Text (string)
barCount (int)
Color (color)
Width (int)
LineStyle (string)
Historical (bool)
Release Notes
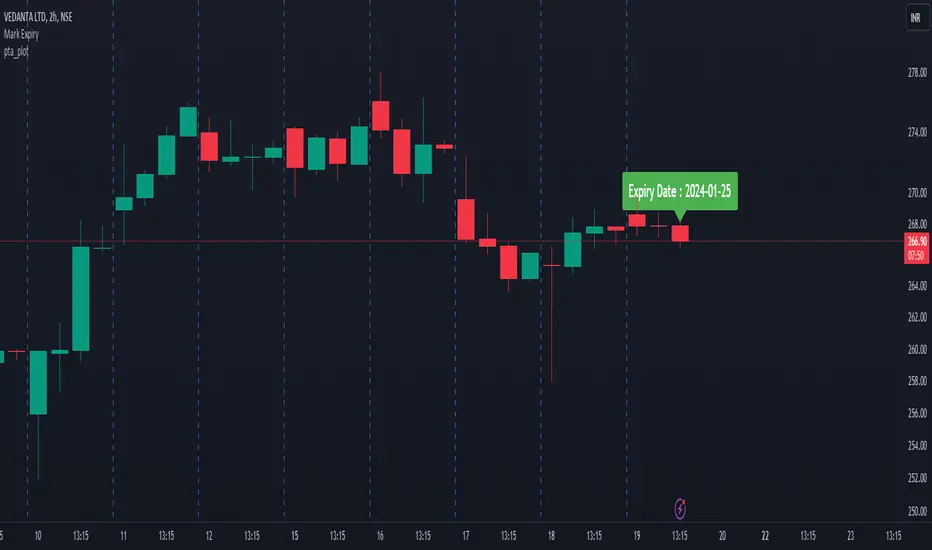
v12Added:
getExpiry(expiryType, expiryDay, changeExpiry, format)
Parameters:
expiryType (string)
expiryDay (string)
changeExpiry (int)
format (string)
Pine library
In true TradingView spirit, the author has published this Pine code as an open-source library so that other Pine programmers from our community can reuse it. Cheers to the author! You may use this library privately or in other open-source publications, but reuse of this code in publications is governed by House Rules.
Disclaimer
The information and publications are not meant to be, and do not constitute, financial, investment, trading, or other types of advice or recommendations supplied or endorsed by TradingView. Read more in the Terms of Use.