OPEN-SOURCE SCRIPT
FOMO Indicator - % of Stocks Above 5-Day Avg
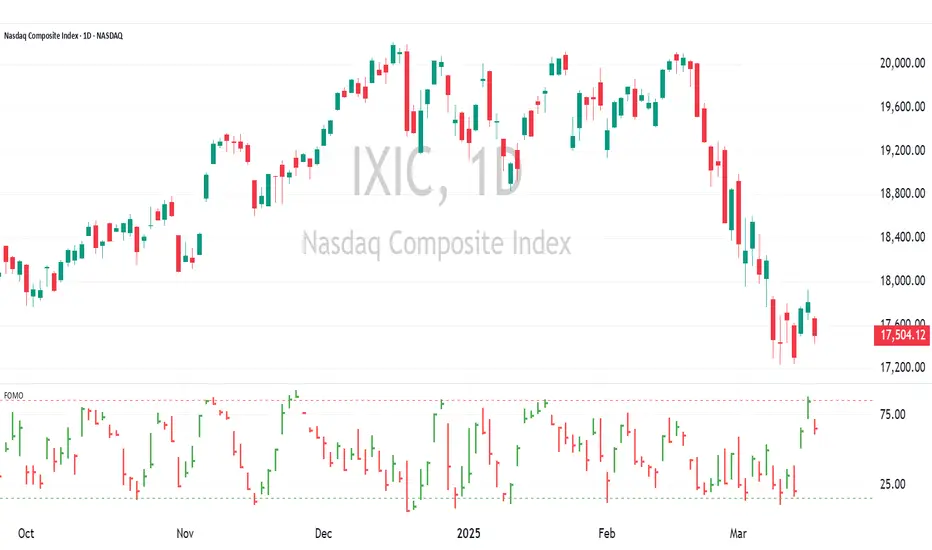
The FOMO Indicator plots the breadth indicators NCFD and S5FD below the price chart, representing the percentage of stocks in the Nasdaq Composite (NCFD) or S&P 500 (S5FD) trading above their respective 5-day moving averages.
This indicator identifies short-term market sentiment and investor positioning. When over 85% of stocks exceed their 5-day averages, it signals widespread buying pressure and potential FOMO (Fear Of Missing Out) among investors. Conversely, levels below 15% may indicate oversold conditions. By analyzing these breadth metrics over a short time window, the FOMO Indicator helps traders gauge shifts in investor sentiment and positioning.
This indicator identifies short-term market sentiment and investor positioning. When over 85% of stocks exceed their 5-day averages, it signals widespread buying pressure and potential FOMO (Fear Of Missing Out) among investors. Conversely, levels below 15% may indicate oversold conditions. By analyzing these breadth metrics over a short time window, the FOMO Indicator helps traders gauge shifts in investor sentiment and positioning.
Open-source script
In true TradingView spirit, the creator of this script has made it open-source, so that traders can review and verify its functionality. Kudos to the author! While you can use it for free, remember that republishing the code is subject to our House Rules.
Get access to CarusoInsights indicators: carusoinsights.com/charting/
Disclaimer
The information and publications are not meant to be, and do not constitute, financial, investment, trading, or other types of advice or recommendations supplied or endorsed by TradingView. Read more in the Terms of Use.