OPEN-SOURCE SCRIPT
Histogram ATR-SMA(ATR) by drinchi
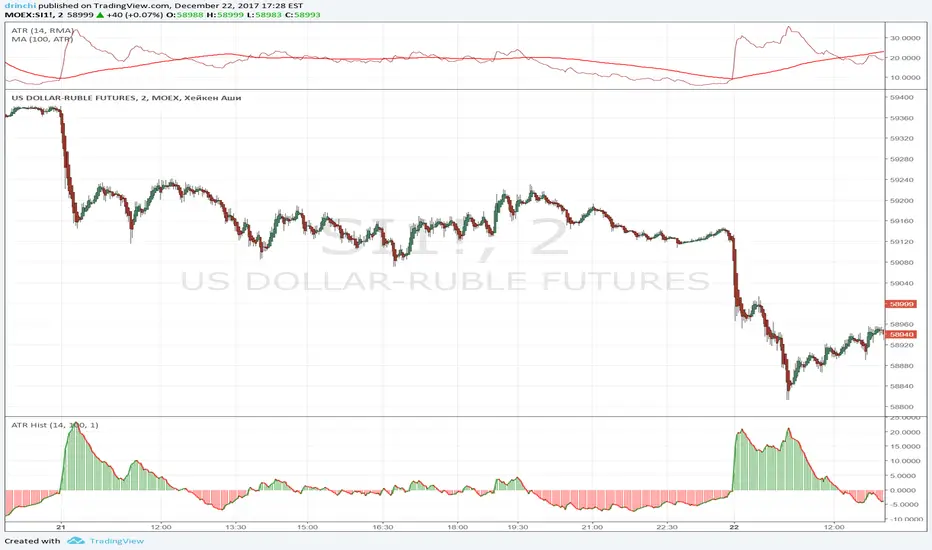
Indicator make histogram from difference of:
- classic ATR (default period - 14)
- Simple Moving Average (default period - 100) to this ATR.
Histogram colored (green when >0, red <0).
Volatility increase signal - histogram crosses the zero line.
For greater visibility, a colored variable moving average (variable SMA for histogram) was added
(green when increase, red when decrease).
Open-source script
In true TradingView spirit, the creator of this script has made it open-source, so that traders can review and verify its functionality. Kudos to the author! While you can use it for free, remember that republishing the code is subject to our House Rules.
Disclaimer
The information and publications are not meant to be, and do not constitute, financial, investment, trading, or other types of advice or recommendations supplied or endorsed by TradingView. Read more in the Terms of Use.