OPEN-SOURCE SCRIPT
DDDDD: SET50 (40 Stocks) - % New 52W Lows
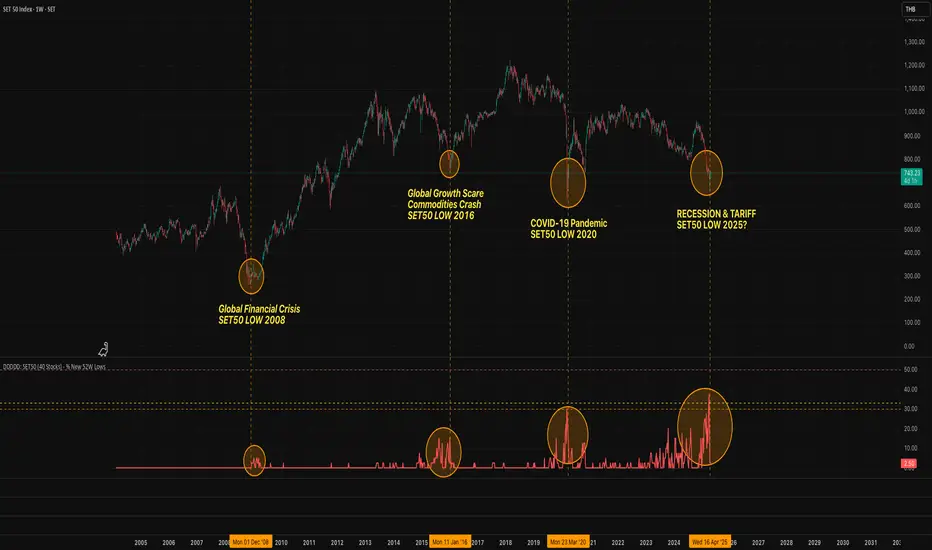
DDDDD: SET50 - % New 52W Lows (40 Stocks)
This indicator measures the percentage of selected SET50 stocks making a new 52-week low, helping identify periods of extreme market fear that often align with long-term buying opportunities.
How It Works:
Tracks the daily closing prices of 40 major SET50 constituents.
A stock is counted when it closes at its lowest price over the past 252 trading days (approximately 1 year).
Calculates the percentage of new 52-week lows relative to 40 stocks.
Displays threshold lines to highlight levels of market panic.
📈 Threshold Levels:
Threshold Line Color Level (%) Interpretation Action
30% Threshold Orange 30% Early signs of stress Start monitoring opportunities
33% Threshold Yellow 33% Confirmed panic Consider gradual accumulation
50% Panic Zone Red 50% Extreme market panic Aggressive accumulation zone
📌 Important Notes:
Why not use the full 50 stocks?
Due to TradingView Pine Script's current technical limits, a script cannot request data for more than 40 symbols efficiently.
Therefore, this indicator uses 40 representative SET50 stocks to ensure optimal performance without exceeding system limits.
The selected stocks are diversified across major sectors to maintain reliability.
🔥 Key Insights:
Historically, spikes above 30%-50% of stocks making new lows have coincided with major market bottoms (e.g., 2011, 2020).
Higher simultaneous new lows = stronger potential for long-term recovery.
Open-source script
In true TradingView spirit, the creator of this script has made it open-source, so that traders can review and verify its functionality. Kudos to the author! While you can use it for free, remember that republishing the code is subject to our House Rules.
Disclaimer
The information and publications are not meant to be, and do not constitute, financial, investment, trading, or other types of advice or recommendations supplied or endorsed by TradingView. Read more in the Terms of Use.