OPEN-SOURCE SCRIPT
RCI Strategy [PineIndicators]
RCI Strategy [PineIndicators]
This strategy leverages the Rank Correlation Index (RCI) — a statistical oscillator that measures the relationship between time and price rank — combined with a configurable moving average filter. It offers clean, rule-based entries and exits, and visually enhanced trade tracking via labeled markers and boxes on the chart.
The RCI Strategy is well-suited for momentum traders looking to capture directional shifts with confirmation through RCI smoothing.
Core Logic
1. Rank Correlation Index (RCI)
2. RCI Smoothing via Moving Average
Trade Entry Logic
Visual Features
RCI Panel Display
Trade Labels on Chart
Trade Visualization Boxes
Customization Parameters
Use Cases
Conclusion
The RCI Strategy [PineIndicators] is a non-repainting, rule-based trading model that combines rank correlation momentum with smoothed trend logic. Its clean visual markers, labeled trades, and flexible MA filters make it a valuable tool for discretionary and systematic traders alike.
This strategy leverages the Rank Correlation Index (RCI) — a statistical oscillator that measures the relationship between time and price rank — combined with a configurable moving average filter. It offers clean, rule-based entries and exits, and visually enhanced trade tracking via labeled markers and boxes on the chart.
The RCI Strategy is well-suited for momentum traders looking to capture directional shifts with confirmation through RCI smoothing.
Core Logic
1. Rank Correlation Index (RCI)
- Measures how closely price changes correlate with time rankings.
- Values range between -100 and +100.
- Thresholds at ±80 help identify potential reversals or extremes.
2. RCI Smoothing via Moving Average
- A moving average (MA) is applied to the RCI to smooth out fluctuations.
- Supported MA types:
SMA
EMA
SMMA (RMA)
WMA
VWMA - Users can disable the smoothing by selecting "None".
Trade Entry Logic
- Long Entry: RCI crosses above the selected moving average.
- Short Entry: RCI crosses below the moving average.
- Entries are restricted by trade direction settings:
- Long Only
- Short Only
- Long & Short
- Long Only
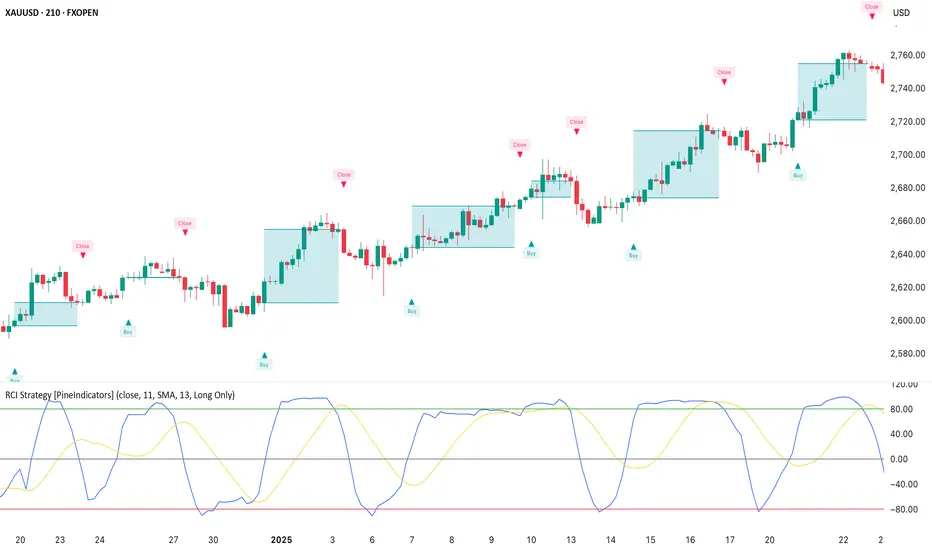
Visual Features
RCI Panel Display
- Plots RCI line and its moving average in a separate pane.
- Horizontal guide lines at 0, +80, and -80 help visualize signal zones.
Trade Labels on Chart
- Buy Label: Plotted when a long entry is executed.
- Close Label: Plotted when any position is closed.
- Triangle markers for visual emphasis on direction change.
Trade Visualization Boxes
- A colored box is drawn between entry and exit prices.
- Green = profitable trade; Red = losing trade.
- Two horizontal lines connect entry and exit prices for reference.
Customization Parameters
- RCI Source: Select input price for the RCI (default: close).
- RCI Length: Set sensitivity of the oscillator.
- MA Type and Length: Choose and configure the smoothing filter.
- Trade Direction Mode: Define whether to allow Long, Short, or both.
Use Cases
- Swing traders who want to trade directional reversals with statistical backing.
- Traders seeking a clean and visual strategy based on rank momentum.
- Environments where both trend and range dynamics occur.
Conclusion
The RCI Strategy [PineIndicators] is a non-repainting, rule-based trading model that combines rank correlation momentum with smoothed trend logic. Its clean visual markers, labeled trades, and flexible MA filters make it a valuable tool for discretionary and systematic traders alike.
Open-source script
In true TradingView spirit, the creator of this script has made it open-source, so that traders can review and verify its functionality. Kudos to the author! While you can use it for free, remember that republishing the code is subject to our House Rules.
Disclaimer
The information and publications are not meant to be, and do not constitute, financial, investment, trading, or other types of advice or recommendations supplied or endorsed by TradingView. Read more in the Terms of Use.