OPEN-SOURCE SCRIPT
Parabolic Detection
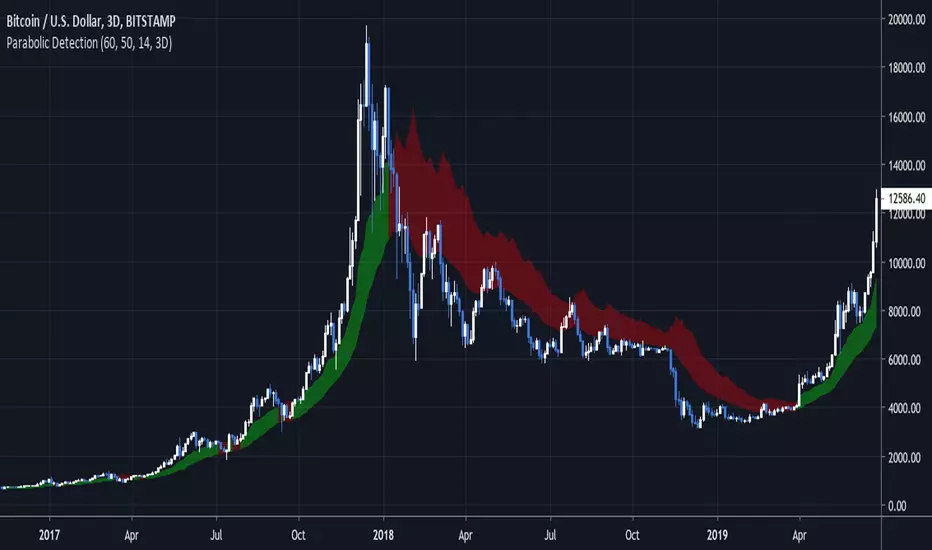
This method of trend analysis draws the RSI channel from 50 to 60 on the chart. If it's over 60, the channel is green.
When Bitcoin goes on its insane runs, the RSI on the 3 day chart will often be pegged at extreme values. Our goal is to visually represent these moments.
By default, this uses the 3 day resolution for its calculations. Feel free to disable this and it will work on any timeframe.
When Bitcoin goes on its insane runs, the RSI on the 3 day chart will often be pegged at extreme values. Our goal is to visually represent these moments.
By default, this uses the 3 day resolution for its calculations. Feel free to disable this and it will work on any timeframe.
Open-source script
In true TradingView spirit, the creator of this script has made it open-source, so that traders can review and verify its functionality. Kudos to the author! While you can use it for free, remember that republishing the code is subject to our House Rules.
Disclaimer
The information and publications are not meant to be, and do not constitute, financial, investment, trading, or other types of advice or recommendations supplied or endorsed by TradingView. Read more in the Terms of Use.