OPEN-SOURCE SCRIPT
Updated EMA/SMA Band
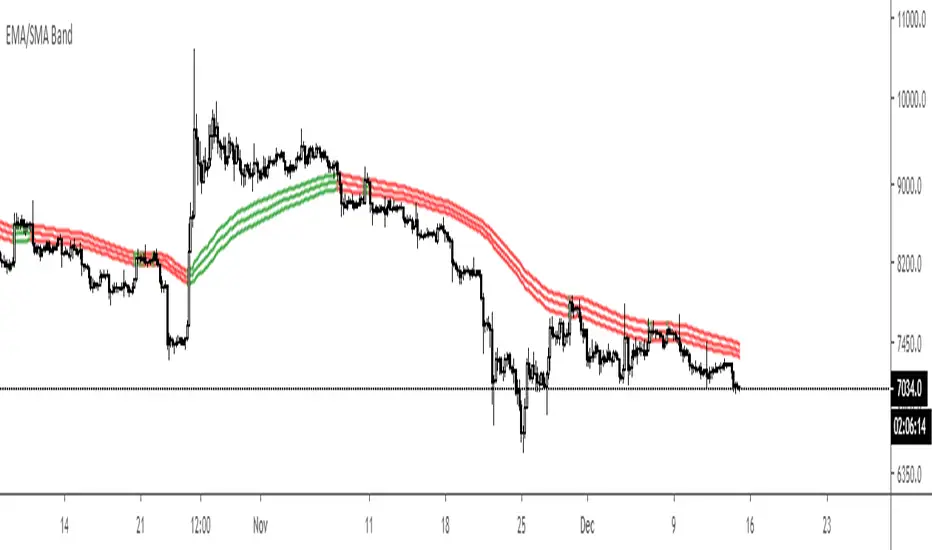
Plot the source high, low and close of any given ema or sma. Support and resistance is defined as an area where price is likely to bounce or get rejected and since MA's are usually just one line, this band is meant to act as an area surrounding the original MA and therefore avoiding fake outs.
Release Notes
Optional green and red color addedOpen-source script
In true TradingView spirit, the creator of this script has made it open-source, so that traders can review and verify its functionality. Kudos to the author! While you can use it for free, remember that republishing the code is subject to our House Rules.
Disclaimer
The information and publications are not meant to be, and do not constitute, financial, investment, trading, or other types of advice or recommendations supplied or endorsed by TradingView. Read more in the Terms of Use.
Open-source script
In true TradingView spirit, the creator of this script has made it open-source, so that traders can review and verify its functionality. Kudos to the author! While you can use it for free, remember that republishing the code is subject to our House Rules.
Disclaimer
The information and publications are not meant to be, and do not constitute, financial, investment, trading, or other types of advice or recommendations supplied or endorsed by TradingView. Read more in the Terms of Use.