OPEN-SOURCE SCRIPT
Long Short dom
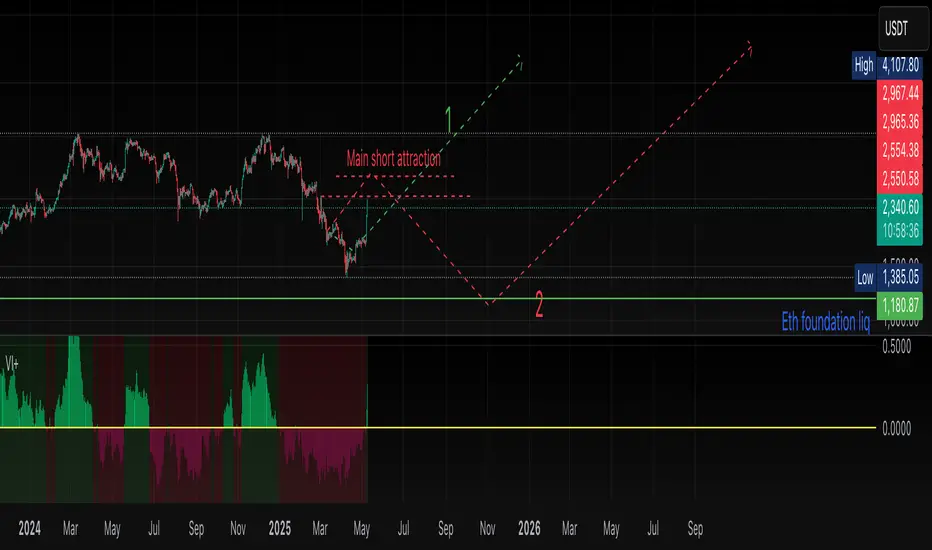
📊 Long Short dom (VI+) — Custom Vortex Trend Strength Indicator
This indicator is a refined version of the Vortex Indicator (VI) designed to help traders identify trend direction, momentum dominance, and potential long/short opportunities based on VI+ and VI– dynamics.
🔍 What It Shows:
• VI+ (Green Line): Measures upward trend strength.
• VI– (Red Line): Measures downward trend strength.
• Histogram (optional): Displays the difference between VI+ and VI–, helping visualize which side is dominant.
• Background Coloring: Highlights bullish or bearish dominance zones.
• Zero Line: A visual baseline to enhance clarity.
• Highest/Lowest Active Lines: Real-time markers for the strongest directional signals.
⸻
🛠️ Inputs:
• Length: Vortex calculation period (default 14).
• Show Histogram: Enable/disable VI+–VI– difference bars.
• Show Trend Background: Toggle colored zones showing trend dominance.
• Show Below Zero: Decide whether to display values that fall below 0 (for advanced use).
⸻
📈 Strategy Insights:
• When VI+ crosses above VI–, it indicates potential long momentum.
• When VI+ crosses below VI–, it signals possible short pressure.
• The delta histogram (VI+ – VI–) helps you quickly see shifts in momentum strength.
• The background shading provides an intuitive visual cue to assess trend dominance at a glance.
⸻
🚨 Built-in Alerts:
• Bullish Cross: VI+ crosses above VI– → possible entry long.
• Bearish Cross: VI+ crosses below VI– → possible entry short.
⸻
✅ Ideal For:
• Trend-following strategies
• Identifying long/short bias
• Confirming entries/exits with momentum analysis
⸻
This tool gives you clean, real-time visual insight into trend strength and shift dynamics, empowering smarter trade decisions with clarity and confidence.
Open-source script
In true TradingView spirit, the creator of this script has made it open-source, so that traders can review and verify its functionality. Kudos to the author! While you can use it for free, remember that republishing the code is subject to our House Rules.
Disclaimer
The information and publications are not meant to be, and do not constitute, financial, investment, trading, or other types of advice or recommendations supplied or endorsed by TradingView. Read more in the Terms of Use.