OPEN-SOURCE SCRIPT
Updated The M Score - Ultimate v5.0
The M Score - Ultimate v5.0
*Introducing M score version 5.0*
Additions to the indicator:
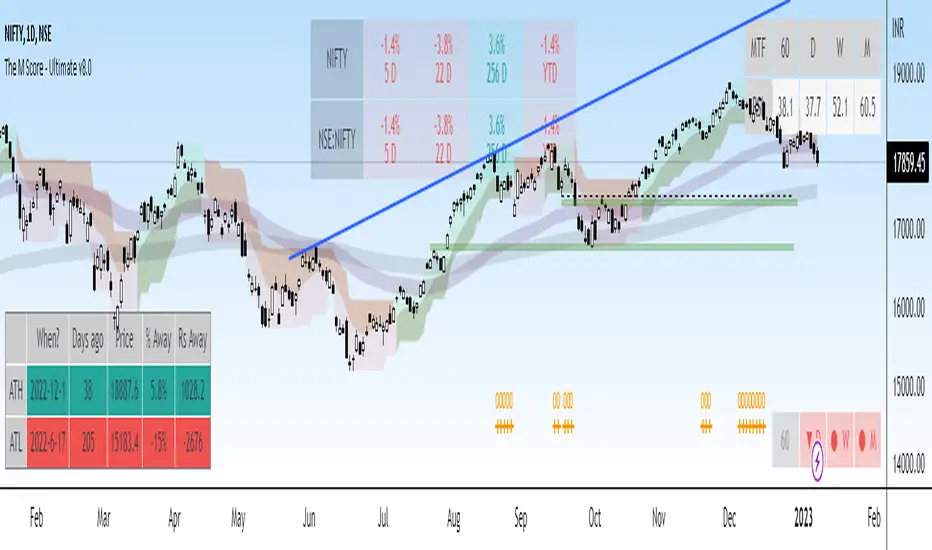
1. 200 EMA Band (High-Low) added
2. Bottom left table - Shows All Time High/Lows (52 weeks) and % away we are from both. The values will not change in this table even if you change the timeframe.
3. Bottom center table - Performance matrix and a quick glance comparison with Nifty with different days of return. This will show if there outperformance or underperformance in the scripts and in which duration.
4. Top Right table - This indicator plots a table off to the right of the chart to help with determining timeframe continuity. A great edge is only taking trades where full timeframe continuity is in place (i.e. if you are going long, make sure other timeframes are also green).
Green candles have green colored boxes, red candles have red colored boxes.
Inside bars are represented by a circle - ⬤
Outside bars are represented by a tall rectangle - ▮
2-up bars are indicated by an up arrow - ▲
2-down bars are indicated by a down arrow - ▼
User defined options:
Pick any timeframe for the 4 boxes
Hope you will will like the efforts.
*Introducing M score version 5.0*
Additions to the indicator:
1. 200 EMA Band (High-Low) added
2. Bottom left table - Shows All Time High/Lows (52 weeks) and % away we are from both. The values will not change in this table even if you change the timeframe.
3. Bottom center table - Performance matrix and a quick glance comparison with Nifty with different days of return. This will show if there outperformance or underperformance in the scripts and in which duration.
4. Top Right table - This indicator plots a table off to the right of the chart to help with determining timeframe continuity. A great edge is only taking trades where full timeframe continuity is in place (i.e. if you are going long, make sure other timeframes are also green).
Green candles have green colored boxes, red candles have red colored boxes.
Inside bars are represented by a circle - ⬤
Outside bars are represented by a tall rectangle - ▮
2-up bars are indicated by an up arrow - ▲
2-down bars are indicated by a down arrow - ▼
User defined options:
Pick any timeframe for the 4 boxes
Hope you will will like the efforts.
Release Notes
Added MTF RSI, Smoothened the Visualization for efficient plottinRelease Notes
Added alerts for cloud change - Buy / Sell.Open-source script
In true TradingView spirit, the creator of this script has made it open-source, so that traders can review and verify its functionality. Kudos to the author! While you can use it for free, remember that republishing the code is subject to our House Rules.
Disclaimer
The information and publications are not meant to be, and do not constitute, financial, investment, trading, or other types of advice or recommendations supplied or endorsed by TradingView. Read more in the Terms of Use.
Open-source script
In true TradingView spirit, the creator of this script has made it open-source, so that traders can review and verify its functionality. Kudos to the author! While you can use it for free, remember that republishing the code is subject to our House Rules.
Disclaimer
The information and publications are not meant to be, and do not constitute, financial, investment, trading, or other types of advice or recommendations supplied or endorsed by TradingView. Read more in the Terms of Use.