OPEN-SOURCE SCRIPT
Updated KDJ-RSI Buy/Sell Signal ver. 1
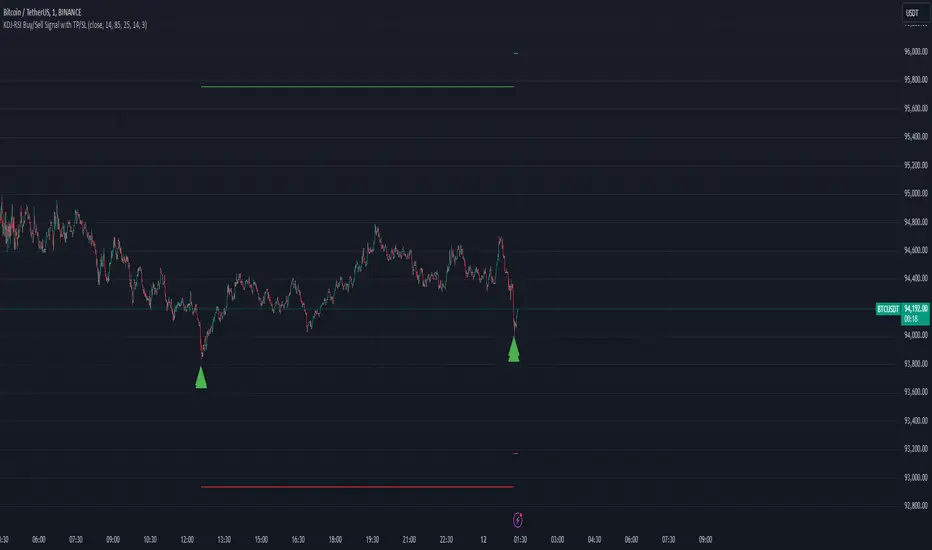
It is an indicator combining the RSI indicator and KDJ indicator.
Buy signal will triggers when:
RSI signal positioning below 25
J value crosses below 0
Sell signal will triggers when:
RSI signal positioning above 85
J value crosses above 100
***********
Please take note that this indicator may be not accurate for every chart in the crypto market, but it is most appropriate to use it in BTC/USDT charts, mainly for 1h, 4h, and 1d candles. Not recommended to use it for 1m or 15m leverage trades, this indicator might be altered by FOMO sentiment.
Release Notes
Version 2 Update!!!Added TP/SL for every timeframe
1 Minute Chart:
Take Profit (TP): 2.0%
Stop Loss (SL): 1.0%
Ratio: 2:1
2 Minute Chart:
Take Profit (TP): 2.5%
Stop Loss (SL): 1.5%
Ratio: 5:3
3 Minute Chart:
Take Profit (TP): 3.0%
Stop Loss (SL): 1.8%
Ratio: 5:3
5 Minute Chart:
Take Profit (TP): 4.0%
Stop Loss (SL): 2.0%
Ratio: 2:1
10 Minute Chart:
Take Profit (TP): 5.0%
Stop Loss (SL): 2.5%
Ratio: 2:1
15 Minute Chart:
Take Profit (TP): 6.0%
Stop Loss (SL): 2.0%
Ratio: 3:1
30 Minute Chart:
Take Profit (TP): 10.0%
Stop Loss (SL): 3.0%
Ratio: 10:3
45 Minute Chart:
Take Profit (TP): 12.0%
Stop Loss (SL): 3.5%
Ratio: ~3.43:1
1 Hour Chart (60 Minutes):
Take Profit (TP): 15.0%
Stop Loss (SL): 3.0%
Ratio: 5:1
2 Hour Chart (120 Minutes):
Take Profit (TP): 20.0%
Stop Loss (SL): 4.0%
Ratio: 5:1
3 Hour Chart (180 Minutes):
Take Profit (TP): 25.0%
Stop Loss (SL): 5.0%
Ratio: 5:1
4 Hour Chart (240 Minutes):
Take Profit (TP): 32.0%
Stop Loss (SL): 4.0%
Ratio: 8:1
Daily, Weekly, or Monthly Chart:
Take Profit (TP): 50.0%
Stop Loss (SL): 5.0%
Ratio: 10:1
Besides that, the TP/SL trigger will be displayed on the chart too.
Open-source script
In true TradingView spirit, the creator of this script has made it open-source, so that traders can review and verify its functionality. Kudos to the author! While you can use it for free, remember that republishing the code is subject to our House Rules.
Disclaimer
The information and publications are not meant to be, and do not constitute, financial, investment, trading, or other types of advice or recommendations supplied or endorsed by TradingView. Read more in the Terms of Use.