OPEN-SOURCE SCRIPT
CAT Shaky Top
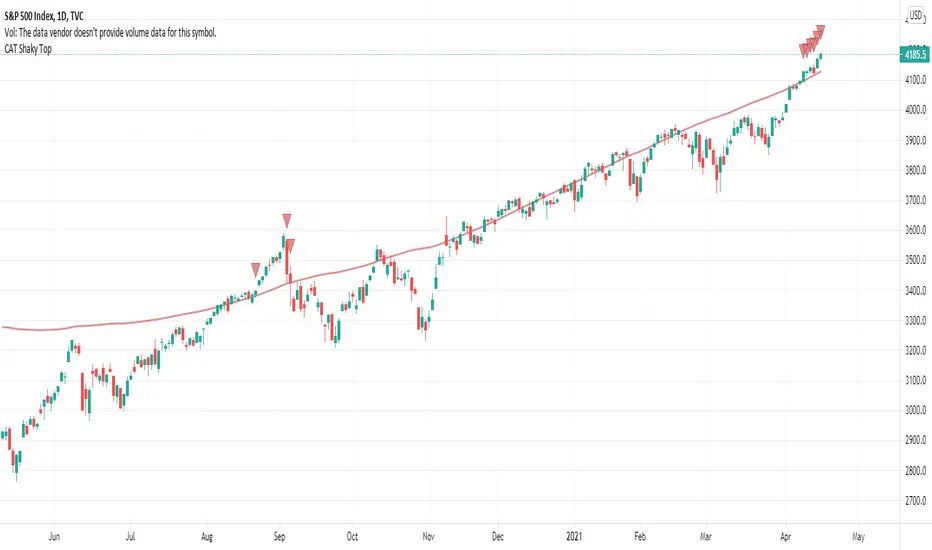
The indicator shows when S&P goes overbought while breadth does not confirm the rally.
The standard conditions are:
- S&P goes over 200 day weighted moving average increased by 10% and
- % of US stocks over 50 DMA holds under 60.
When both conditions are met the indicator plots a red triangle on top of the price.
You can change two inputs to see how often in the past similar cases happened.
If you have any questions please send me email to castawaytrader@gmail.com
Open-source script
In true TradingView spirit, the creator of this script has made it open-source, so that traders can review and verify its functionality. Kudos to the author! While you can use it for free, remember that republishing the code is subject to our House Rules.
Disclaimer
The information and publications are not meant to be, and do not constitute, financial, investment, trading, or other types of advice or recommendations supplied or endorsed by TradingView. Read more in the Terms of Use.