OPEN-SOURCE SCRIPT
Ratio-Adjusted McClellan Summation Index RASI NASI
Ratio-Adjusted McClellan Summation Index (RASI NASI)
In Book "The Complete Guide to Market Breadth Indicators" Author Gregory L. Morris states
"It is the author’s opinion that the McClellan indicators, and in particular, the McClellan Summation Index, is the single best breadth indicator available. If you had to pick just one, this would be it."
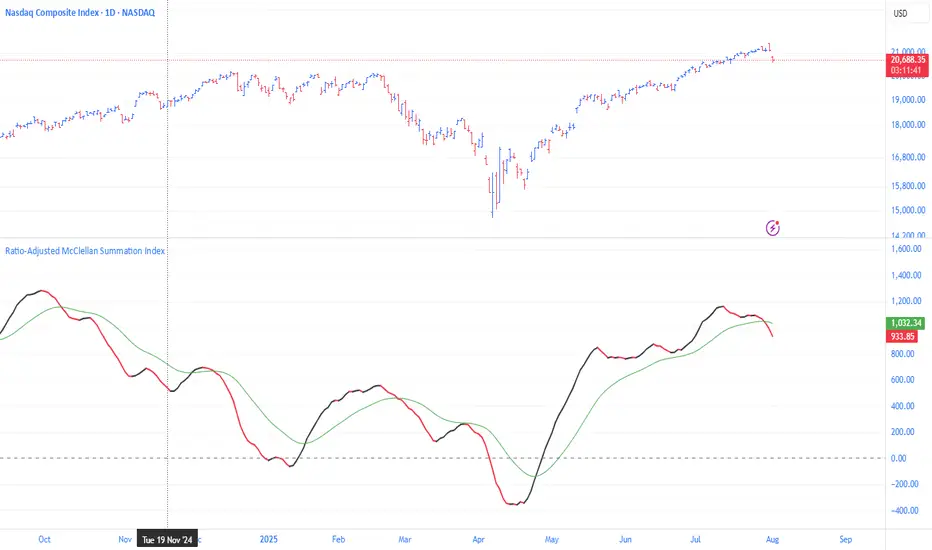
What It Does: The Ratio-Adjusted McClellan Summation Index (RASI) is a market breadth indicator that tracks the cumulative strength of advancing versus declining issues for a user-selected exchange (NASDAQ, NYSE, or AMEX). Derived from the McClellan Oscillator, it calculates ratio-adjusted net advances, applies 19-day and 39-day EMAs, and sums the oscillator values to produce the RASI. This indicator helps traders assess market health, identify bullish or bearish trends, and detect potential reversals through divergences.
Key features:
How to Use
Interpret the Indicator:
Set Alerts:
Settings
Market Selection:
EMA Settings:
RASI Settings:
RASI MA Settings:
Alerts
The indicator uses alertcondition() to create custom alerts. Available conditions:
To set alerts, add the indicator to your chart, open the TradingView alert panel, and select the desired condition.
Notes
Credits
Based on the Ratio-Adjusted McClellan Summation Index methodology by McClellan Financial Publications. No external code was used; the implementation is original, inspired by standard market breadth concepts.
Disclaimer
This indicator is for informational purposes only and does not constitute financial advice. Past performance is not indicative of future results. Conduct your own research and combine with other tools for informed trading decisions.
In Book "The Complete Guide to Market Breadth Indicators" Author Gregory L. Morris states
"It is the author’s opinion that the McClellan indicators, and in particular, the McClellan Summation Index, is the single best breadth indicator available. If you had to pick just one, this would be it."
What It Does: The Ratio-Adjusted McClellan Summation Index (RASI) is a market breadth indicator that tracks the cumulative strength of advancing versus declining issues for a user-selected exchange (NASDAQ, NYSE, or AMEX). Derived from the McClellan Oscillator, it calculates ratio-adjusted net advances, applies 19-day and 39-day EMAs, and sums the oscillator values to produce the RASI. This indicator helps traders assess market health, identify bullish or bearish trends, and detect potential reversals through divergences.
Key features:
- Exchange Selection: Choose NASDAQ (USI:ADVN.NQ, USI:DECL.NQ), NYSE (USI:ADVN.NY, USI:DECL.NY), or AMEX (USI:ADVN.AM, USI:DECL.AM) data.
- Trend-Based Coloring: RASI line displays user-defined colors (default: black for uptrend, red for downtrend) based on its direction.
- Customizable Moving Average: Add a moving average (SMA, EMA, WMA, VWMA, or RMA) with user-defined length and color (default: EMA, 21, green).
- Neutral Line at Zero: Marks the neutral level for trend interpretation.
- Alerts: Six custom alert conditions for trend changes, MA crosses, and zero-line crosses.
How to Use
- Add to Chart: Apply the indicator to any TradingView chart. Ensure access to advancing and declining issues data for the selected exchange.
- Select Exchange: Choose NASDAQ, NYSE, or AMEX in the input settings.
- Customize Settings: Adjust EMA lengths, RASI colors, MA type, length, and color to match your trading style.
Interpret the Indicator:
- RASI Line: Black (default) indicates an uptrend (RASI rising); red indicates a downtrend (RASI falling).
- Above Zero: Suggests bullish market breadth (more advancing issues).
- Below Zero: Indicates bearish breadth (more declining issues).
- MA Crosses: RASI crossing above its MA signals bullish momentum; crossing below signals bearish momentum.
- Divergences: Compare RASI with the market index (e.g., NASDAQ Composite) to identify potential reversals.
- Large Moves: A +3,600-point move from a low (e.g., -1,550 to +1,950) may signal a significant bull run.
Set Alerts:
Settings
Market Selection:
- Exchange: Select NASDAQ, NYSE, or AMEX for advancing/declining issues data.
EMA Settings:
- 19-day EMA Length: Period for the shorter EMA (default: 19).
- 39-day EMA Length: Period for the longer EMA (default: 39).
RASI Settings:
- RASI Uptrend Color: Color for rising RASI (default: black).
- RASI Downtrend Color: Color for falling RASI (default: red).
RASI MA Settings:
- MA Type: Choose SMA, EMA, WMA, VWMA, or RMA (default: EMA).
- MA Length: Set the MA period (default: 21).
- MA Color: Color for the MA line (default: green).
Alerts
The indicator uses alertcondition() to create custom alerts. Available conditions:
- RASI Trend Up: RASI starts rising (based on RASI > previous RASI, shown as black line).
- RASI Trend Down: RASI starts falling (based on RASI ≤ previous RASI, shown as red line).
- RASI Above MA: RASI crosses above its moving average.
- RASI Below MA: RASI crosses below its moving average.
- RASI Bullish: RASI crosses above zero (bullish market breadth).
- RASI Bearish: RASI crosses below zero (bearish market breadth).
To set alerts, add the indicator to your chart, open the TradingView alert panel, and select the desired condition.
Notes
- Data Requirements: Requires access to advancing/declining issues data (e.g., USI:ADVN.NQ, USI:DECL.NQ for NASDAQ). Some symbols may require a TradingView premium subscription.
- Limitations: RASI is a medium- to long-term indicator and may lag in volatile or range-bound markets. Use alongside other technical tools for confirmation.
- Data Reliability: Verify the selected exchange’s data accuracy, as inconsistencies can affect results.
- Debugging: If no data appears, check symbol validity (e.g., try AADVN/Q, DDECN/Q for NASDAQ) or contact TradingView support.
Credits
Based on the Ratio-Adjusted McClellan Summation Index methodology by McClellan Financial Publications. No external code was used; the implementation is original, inspired by standard market breadth concepts.
Disclaimer
This indicator is for informational purposes only and does not constitute financial advice. Past performance is not indicative of future results. Conduct your own research and combine with other tools for informed trading decisions.
Open-source script
In true TradingView spirit, the creator of this script has made it open-source, so that traders can review and verify its functionality. Kudos to the author! While you can use it for free, remember that republishing the code is subject to our House Rules.
Disclaimer
The information and publications are not meant to be, and do not constitute, financial, investment, trading, or other types of advice or recommendations supplied or endorsed by TradingView. Read more in the Terms of Use.