OPEN-SOURCE SCRIPT
Updated Liquidity Grab Screener | Flux Charts
💎 GENERAL OVERVIEW
Introducing our new Liquidity Grab Screener! This screener can provide information about the latest liquidity grabs in up to 5 tickers. You can also customize the algorithm that finds the liquidity grabs and the styling of the screener.

Features of the new Liquidity Grab Screener :
📌 HOW DOES IT WORK ?
Liquidity grabs occur when one of the latest pivots has a false breakout. Then, if the wick to body ratio of the bar is higher than 0.5 (can be changed from the settings) a bubble is plotted.

The bubble size is determined by the wick to body ratio of the candle.
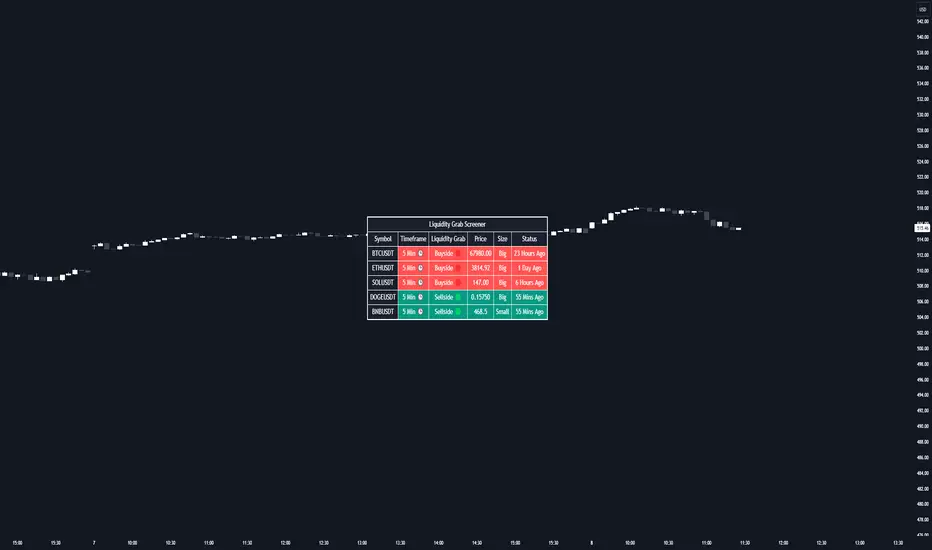
This screener then finds liquidity grabs accross 5 different tickers, and shows the latest information about them.

Price -> The price when the liquidity grab happened.
Size -> Size of the liquidity grab, determined by the wick-body ratio.
Status -> Shows the elapsed time of the liquidity grab.
🚩UNIQUENESS
Liquidity grabs can be useful when determining candles that have executed a lot of market orders, and planning your trades accordingly. This screener will find liquidity grabs from up to 5 tickers and give information about their price, size and status. The screener also lets you customize the pivot length and the wick-body ratio for liquidity grabs.

⚙️SETTINGS
1. Tickers
You can set up to 5 tickers for the screener to scan order blocks here. You can also enable / disable them and set their individual timeframes.
2. General Configuration
Pivot Length -> This setting determines the range of the pivots. This means a candle has to have the highest / lowest wick of the previous X bars and the next X bars to become a high / low pivot.
Wick-Body Ratio -> After a pivot has a false breakout, the wick-body ratio of the latest candle is tested. The resulting ratio must be higher than this setting for it to be considered as a liquidity grab.


Introducing our new Liquidity Grab Screener! This screener can provide information about the latest liquidity grabs in up to 5 tickers. You can also customize the algorithm that finds the liquidity grabs and the styling of the screener.
Features of the new Liquidity Grab Screener :
- Find Latest Liquidity Grabs Accross 5 Tickers
- Price, Size, Status Information
- Customizable Algoritm / Styling
📌 HOW DOES IT WORK ?
Liquidity grabs occur when one of the latest pivots has a false breakout. Then, if the wick to body ratio of the bar is higher than 0.5 (can be changed from the settings) a bubble is plotted.
The bubble size is determined by the wick to body ratio of the candle.
This screener then finds liquidity grabs accross 5 different tickers, and shows the latest information about them.
Price -> The price when the liquidity grab happened.
Size -> Size of the liquidity grab, determined by the wick-body ratio.
Status -> Shows the elapsed time of the liquidity grab.
🚩UNIQUENESS
Liquidity grabs can be useful when determining candles that have executed a lot of market orders, and planning your trades accordingly. This screener will find liquidity grabs from up to 5 tickers and give information about their price, size and status. The screener also lets you customize the pivot length and the wick-body ratio for liquidity grabs.
⚙️SETTINGS
1. Tickers
You can set up to 5 tickers for the screener to scan order blocks here. You can also enable / disable them and set their individual timeframes.
2. General Configuration
Pivot Length -> This setting determines the range of the pivots. This means a candle has to have the highest / lowest wick of the previous X bars and the next X bars to become a high / low pivot.
Wick-Body Ratio -> After a pivot has a false breakout, the wick-body ratio of the latest candle is tested. The resulting ratio must be higher than this setting for it to be considered as a liquidity grab.
Release Notes
Added additional display settings.Open-source script
In true TradingView spirit, the creator of this script has made it open-source, so that traders can review and verify its functionality. Kudos to the author! While you can use it for free, remember that republishing the code is subject to our House Rules.
Access Flux Charts' exclusive indicators: fluxcharts.com/
Join our Discord community: discord.gg/FluxCharts
Join our Discord community: discord.gg/FluxCharts
Disclaimer
The information and publications are not meant to be, and do not constitute, financial, investment, trading, or other types of advice or recommendations supplied or endorsed by TradingView. Read more in the Terms of Use.
Open-source script
In true TradingView spirit, the creator of this script has made it open-source, so that traders can review and verify its functionality. Kudos to the author! While you can use it for free, remember that republishing the code is subject to our House Rules.
Access Flux Charts' exclusive indicators: fluxcharts.com/
Join our Discord community: discord.gg/FluxCharts
Join our Discord community: discord.gg/FluxCharts
Disclaimer
The information and publications are not meant to be, and do not constitute, financial, investment, trading, or other types of advice or recommendations supplied or endorsed by TradingView. Read more in the Terms of Use.