OPEN-SOURCE SCRIPT
fractal candle
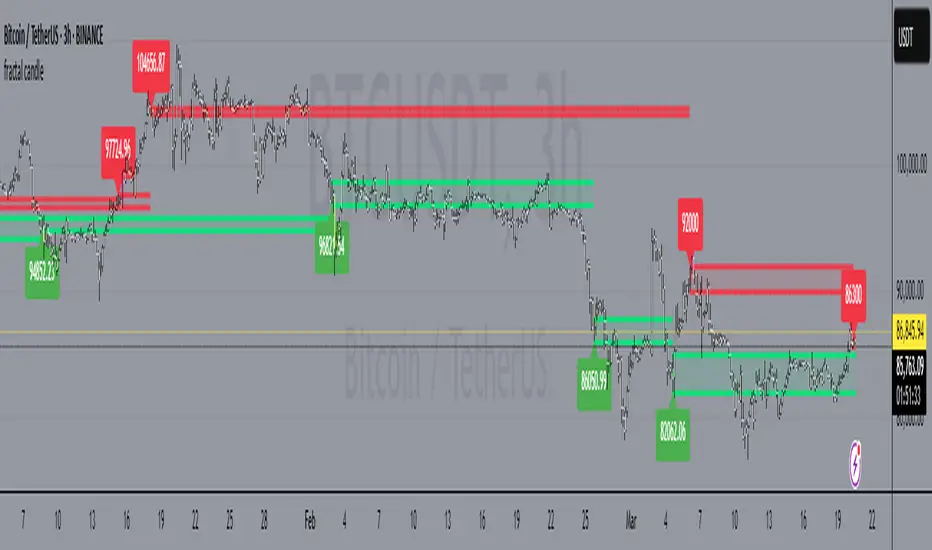
The fractal candle technical indicator to identify potential trend reversals in financial markets. It works by counting a series of price bars and looking for specific patterns that indicate when a trend is likely to reverse.
How the Indicator Works:
Counting Candles:
The indicator compares the closing price of the current candle with the closing price from 4 candles ago.
If the current close is higher, the bullish (buy) count increases.
If the current close is lower, the bearish (sell) count increases.
When a count reaches 9 or 13, it may signal a trend reversal.
Buy and Sell Setup:
A buy setup occurs when there have been 9 consecutive candles where each close is lower than the close 4 candles before. This suggests a possible bullish reversal.
A sell setup occurs when there have been 9 consecutive candles where each close is higher than the close 4 candles before. This suggests a possible bearish reversal.
Support and Resistance Levels:
The indicator tracks previous highs and lows during buy/sell setups to identify potential support and resistance levels.
These levels can help traders decide where price might reverse or consolidate.
Candle Coloring for Visual Aid:
The script changes candle colors:
Red for sell signals 📉
Green for buy signals 📈
Different shades for overshoot conditions (extended trends)
Open-source script
In true TradingView spirit, the creator of this script has made it open-source, so that traders can review and verify its functionality. Kudos to the author! While you can use it for free, remember that republishing the code is subject to our House Rules.
Disclaimer
The information and publications are not meant to be, and do not constitute, financial, investment, trading, or other types of advice or recommendations supplied or endorsed by TradingView. Read more in the Terms of Use.