OPEN-SOURCE SCRIPT
Updated Sharktank - Pi Cycle Prediction
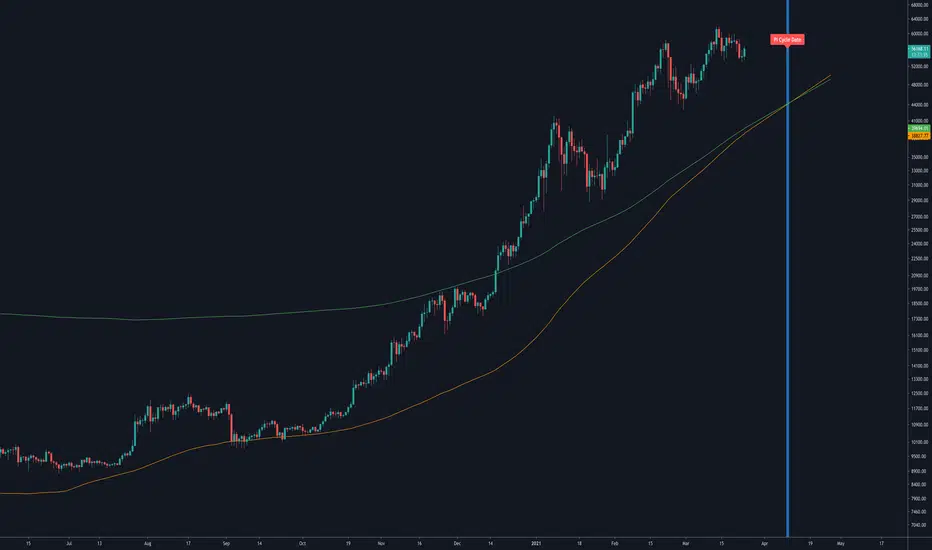
The Pi Cycle indicator has called tops in Bitcoin quite accurately. Assuming history repeats itself, knowledge about when it might happen again could benefit you.
The indicator is fairly simple:
- A daily moving average of 350 ("long_ma" in script)
- A daily moving average of 111 ("short_ma" in script)
The value of the long moving average is multiplied by two. This way the longer moving average appears above the shorter one.
When the shorter one (orange colored) crosses above the longer (green colored) one, it could mean the top is in.
These moving averages rise at a certain rate. Using these rates we could try to estimate a possible crossover moment. That's exactly what this indicator does! It gives the user a prediction of when a crossover might happen.
Special thanks to:
- Ninorigo, for making his indicator public. This one uses his as a starting point.
- The_Caretaker, for coming up with this idea about calling a top. Yet, his is more price-based, this one is more time-based.
Release Notes
Inputs have been updated to incorporate Pine v4 March 2021 updates. Inputs now feature tooltips for additional information and are sorted by groups.An unused input had been removed.
Previous version of the indicator only looked at the increase of the moving averages during the last day and extrapolated the increase. This extrapolation gave the predicted cross date. This newer version still features that approach, but also added the possibility to smooth out the increase. This way the extrapolation is not solely based on the moving average increase during the last day, but used the increase of the past three (default, but users can change this) days.
The extrapolation is shown using two lines.
Feature to show how many days are left until the cross.
Release Notes
Updated the TradingView script image shown at the top.Open-source script
In true TradingView spirit, the creator of this script has made it open-source, so that traders can review and verify its functionality. Kudos to the author! While you can use it for free, remember that republishing the code is subject to our House Rules.
Disclaimer
The information and publications are not meant to be, and do not constitute, financial, investment, trading, or other types of advice or recommendations supplied or endorsed by TradingView. Read more in the Terms of Use.
Open-source script
In true TradingView spirit, the creator of this script has made it open-source, so that traders can review and verify its functionality. Kudos to the author! While you can use it for free, remember that republishing the code is subject to our House Rules.
Disclaimer
The information and publications are not meant to be, and do not constitute, financial, investment, trading, or other types of advice or recommendations supplied or endorsed by TradingView. Read more in the Terms of Use.