OPEN-SOURCE SCRIPT
Updated [blackcat] L1 Vitali Apirine Exponential Deviation Bands
Level 1
Background
Vitali Apirine’s articles in the July issues on 2019,“Exponential Deviation Bands”
Function
In “Exponential Deviation Bands” in this issue, author Vitali Apirine introduces a price band indicator based on exponential deviation rather than the more traditional standard deviation, such as is used in the well-known Bollinger Bands. As compared to standard deviation bands, the author’s exponential deviation bands apply more weight to recent data and generate fewer breakouts. Apirine describes using the bands as a tool to assist in identifying trends.
Remarks
Feedbacks are appreciated.
Release Notes
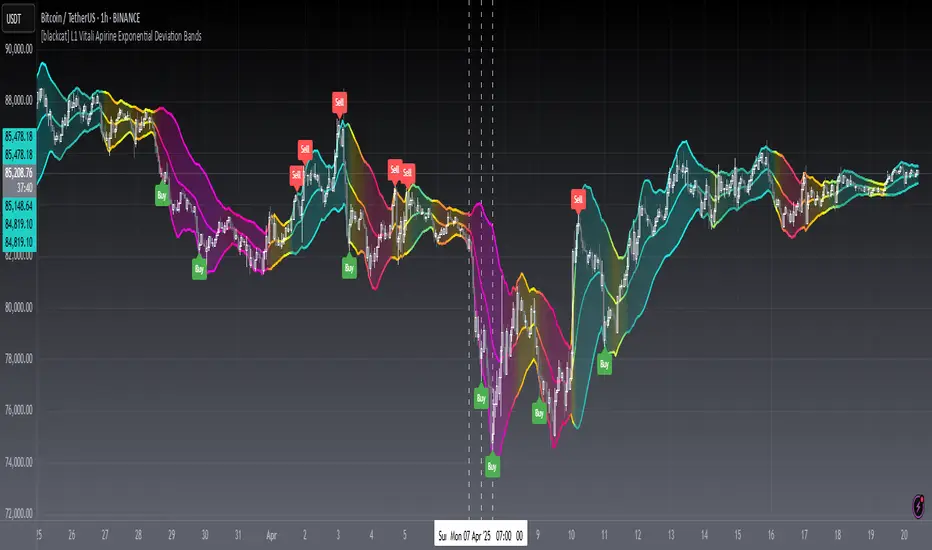
OVERVIEWThe [blackcat] L1 Vitali Apirine Exponential Deviation Bands indicator is designed to help traders visualize price deviations using exponential moving averages. This script calculates custom deviation bands that adapt to market volatility, providing a dynamic view of potential support and resistance levels 📊💹.
FEATURES
Calculates exponential deviation bands based on user-defined parameters:
Periods: Number of bars used for calculations.
Deviation Multiplier: Factor applied to the standard deviation.
Use SMA?: Option to use Simple Moving Average instead of EMA.
Exponential Deviation Threshold: Minimum deviation required for signals.
Plots three main lines on the chart:
Average Value: Central line representing the smoothed price.
Upper Band: Upper boundary of the deviation range.
Lower Band: Lower boundary of the deviation range.
Uses gradient colors to represent different levels of deviation visually 🌈
Displays 'Buy' and 'Sell' labels when specific conditions are met:
Buy signal: Price crosses above the lower band with sufficient deviation.
Sell signal: Price crosses below the upper band with sufficient deviation.
HOW TO USE
Add the indicator to your TradingView chart by selecting it from the indicators list.
Adjust the input parameters (Periods, Deviation Multiplier, etc.) to fit your trading strategy ⚙️.
Observe the plotted bands and labels on the chart to identify potential trade opportunities.
Use the gradient colors as additional context for understanding market volatility.
LIMITATIONS
The indicator may generate false signals in highly volatile or ranging markets 🌪️.
Users should combine this indicator with other forms of analysis for more reliable trading decisions.
The effectiveness of the indicator may vary depending on the asset and timeframe being analyzed.
NOTES
Ensure that you have sufficient historical data available for accurate calculations.
Test the indicator thoroughly on demo accounts before applying it to live trading 🔍.
Customize the appearance and parameters as needed to fit your trading strategy.
Open-source script
In true TradingView spirit, the creator of this script has made it open-source, so that traders can review and verify its functionality. Kudos to the author! While you can use it for free, remember that republishing the code is subject to our House Rules.
Avoid losing contact!Don't miss out! The first and most important thing to do is to join my Discord chat now! Click here to start your adventure: discord.com/invite/ZTGpQJq 防止失联,请立即行动,加入本猫聊天群: discord.com/invite/ZTGpQJq
Disclaimer
The information and publications are not meant to be, and do not constitute, financial, investment, trading, or other types of advice or recommendations supplied or endorsed by TradingView. Read more in the Terms of Use.