OPEN-SOURCE SCRIPT
Updated tr_vol
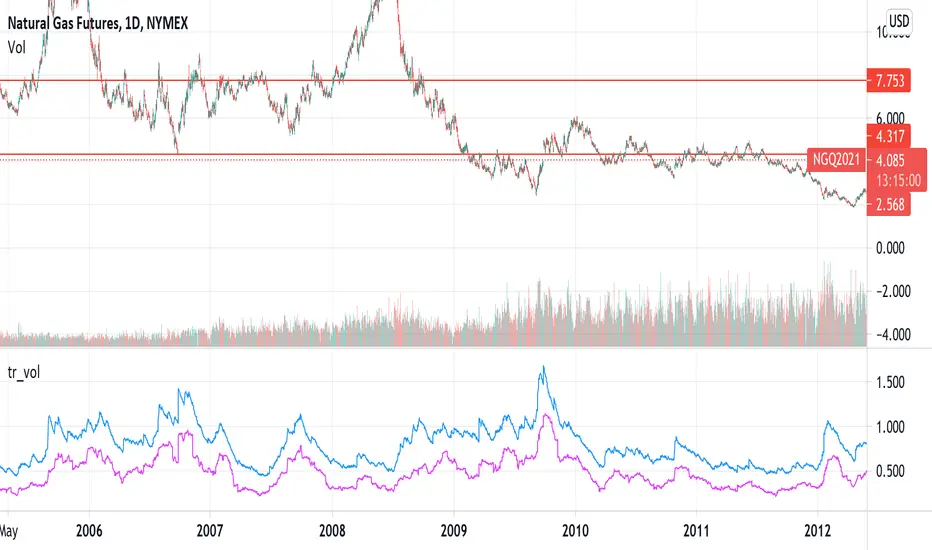
This indicator shows the annualized volatility, computed using the ewma method. It also uses average true range (ATR) as the daily return, rather than the typical close-to-close percentage change. You can uncomment the "comparison" series to see how it compares to the standard deviation, daily log return method. The standard deviation method weights all periods equally and doesn't account for intra-day ranges, meaning it is less responsive to new information than the ewma method and doesn't weight large intra-day moves as heavily.
The long-run median is also displayed. This feature sometimes fails if there are too many bars.
The long-run median is also displayed. This feature sometimes fails if there are too many bars.
Release Notes
I was annualizing incorrectly. Should be fixed now. The script only works on daily for now... may update for different time frames in the future.Open-source script
In true TradingView spirit, the creator of this script has made it open-source, so that traders can review and verify its functionality. Kudos to the author! While you can use it for free, remember that republishing the code is subject to our House Rules.
Disclaimer
The information and publications are not meant to be, and do not constitute, financial, investment, trading, or other types of advice or recommendations supplied or endorsed by TradingView. Read more in the Terms of Use.
Open-source script
In true TradingView spirit, the creator of this script has made it open-source, so that traders can review and verify its functionality. Kudos to the author! While you can use it for free, remember that republishing the code is subject to our House Rules.
Disclaimer
The information and publications are not meant to be, and do not constitute, financial, investment, trading, or other types of advice or recommendations supplied or endorsed by TradingView. Read more in the Terms of Use.