OPEN-SOURCE SCRIPT
EMA 730 Ribbon MTF - Support and Reistance
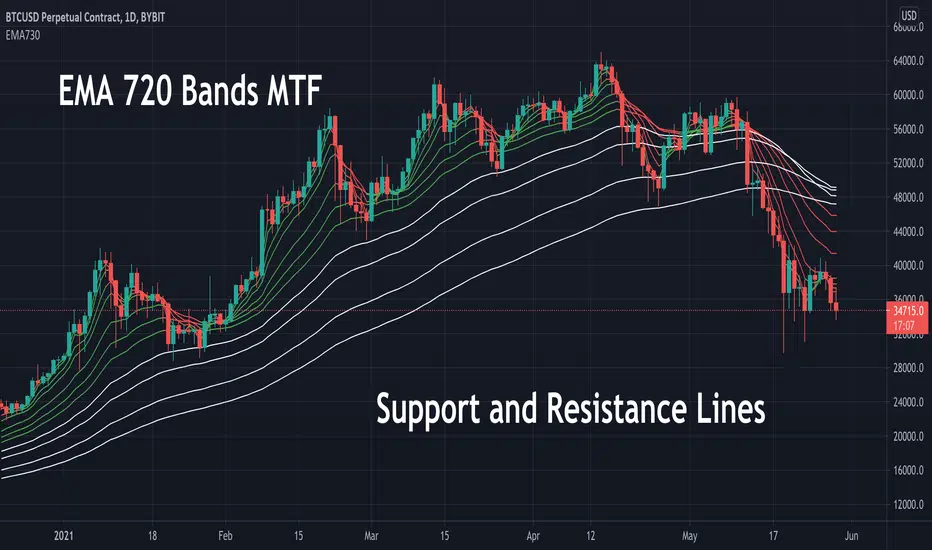
The EMA 730 line is a great way to show dynamic support and resistance . Price action travels "through" this line on each timeframe. This script pulls the EMA 730 Line from multiple timeframes so a trader can visually see price action bounce between support and resistance lines. Lower bands (white lines) can be turned off using "tickbox" in settings. EMA length can also be adjusted in settings. Some charts may work better with a length of 750.

Example of EMA Bands on lower timeframe.
Example of EMA Bands on lower timeframe.
Open-source script
In true TradingView spirit, the creator of this script has made it open-source, so that traders can review and verify its functionality. Kudos to the author! While you can use it for free, remember that republishing the code is subject to our House Rules.
Disclaimer
The information and publications are not meant to be, and do not constitute, financial, investment, trading, or other types of advice or recommendations supplied or endorsed by TradingView. Read more in the Terms of Use.