OPEN-SOURCE SCRIPT
Nebula Volatility and Compression Radar (TechnoBlooms)
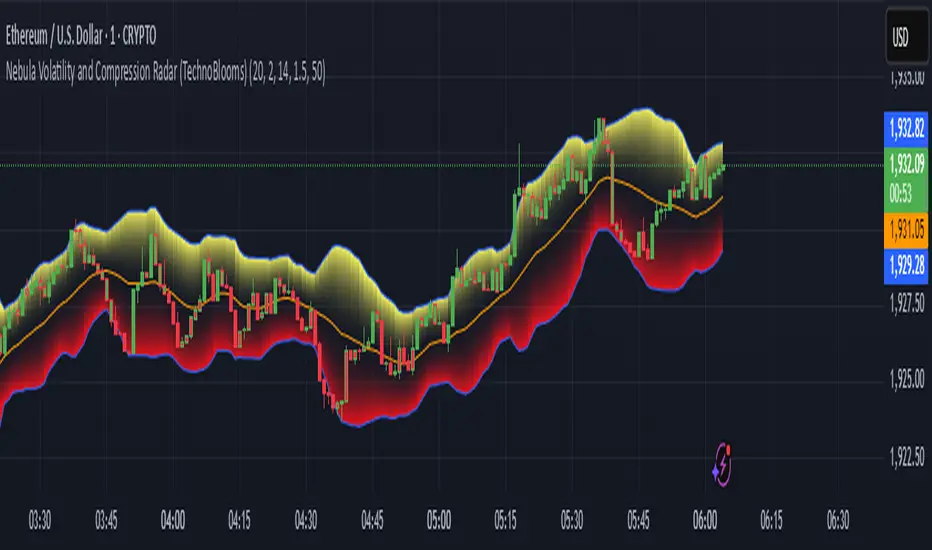
This dynamic indicator spots volatility compression and expansion zones, highlighting breakout opportunities with precision. Featuring vibrant Bollinger Bands, trend-colored candles and real-time signals, Nebula Volatility and Compression Radar (NVCR) is your radar for navigating price moves.
Key Features:-
1. Gradient Bollinger Bands - Visually stunning bands with gradient fills for clear price boundaries.

The gradient filling is coded simply so that even beginners can easily understand the concept. Trader can change the gradient color according to their preference.
fill(pupBB, pbaseBB,upBB,baseBB,top_color=color.rgb(238, 236, 94), bottom_color=color.new(chart.bg_color,100),title = "fill color", display =display.all,fillgaps = true,editable = false)
fill(pbaseBB, plowBB,baseBB,lowBB,top_color=color.new(chart.bg_color,100),bottom_color=color.rgb(230, 20, 30),title = "fill color", display =display.all,fillgaps = true,editable = false)
These two lines are used for giving gradient shades. You can change the colors as per your wish to give preferred color combination.
For Example:

Another Example:

2. Customizable Settings - Adjust Bollinger Bands, ATR and trend lengths to fit your trading styles.
3. Trend Insights - Candles turn green for uptrends, red for downtrends, and gray for neutral zones.
Nebula Volatility and Compression Radar create dynamic cloud like zones that illuminate trends with clarity.
Key Features:-
1. Gradient Bollinger Bands - Visually stunning bands with gradient fills for clear price boundaries.
The gradient filling is coded simply so that even beginners can easily understand the concept. Trader can change the gradient color according to their preference.
fill(pupBB, pbaseBB,upBB,baseBB,top_color=color.rgb(238, 236, 94), bottom_color=color.new(chart.bg_color,100),title = "fill color", display =display.all,fillgaps = true,editable = false)
fill(pbaseBB, plowBB,baseBB,lowBB,top_color=color.new(chart.bg_color,100),bottom_color=color.rgb(230, 20, 30),title = "fill color", display =display.all,fillgaps = true,editable = false)
These two lines are used for giving gradient shades. You can change the colors as per your wish to give preferred color combination.
For Example:
Another Example:
2. Customizable Settings - Adjust Bollinger Bands, ATR and trend lengths to fit your trading styles.
3. Trend Insights - Candles turn green for uptrends, red for downtrends, and gray for neutral zones.
Nebula Volatility and Compression Radar create dynamic cloud like zones that illuminate trends with clarity.
Open-source script
In true TradingView spirit, the creator of this script has made it open-source, so that traders can review and verify its functionality. Kudos to the author! While you can use it for free, remember that republishing the code is subject to our House Rules.
Disclaimer
The information and publications are not meant to be, and do not constitute, financial, investment, trading, or other types of advice or recommendations supplied or endorsed by TradingView. Read more in the Terms of Use.