OPEN-SOURCE SCRIPT
ATR Combo
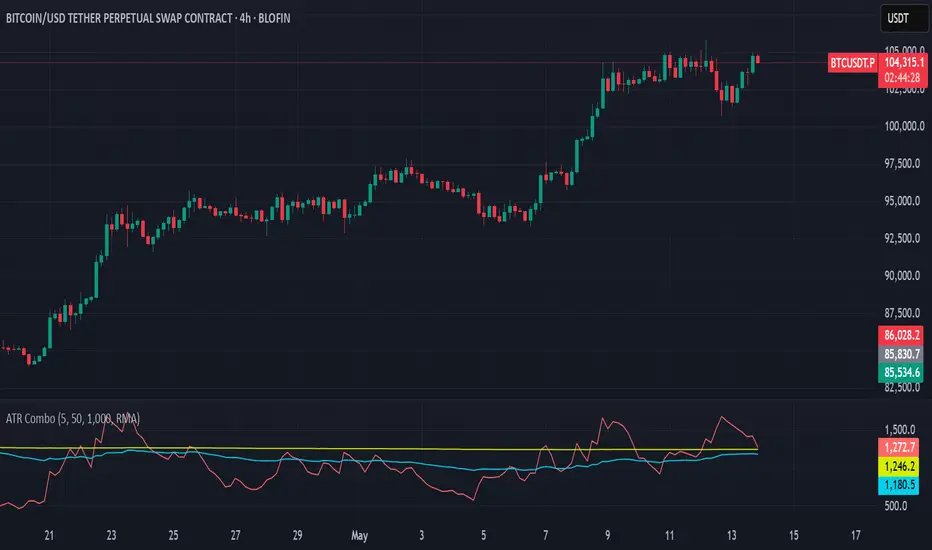
A Collection of three ATRs.
The whole idea of this indicator is to easily visualise the relationship of volatility to the current price action.
The default settings are:
5 Moving Average (Pink)
50 Moving Average (Blue)
1000 Moving Average (Yellow)
Using the default settings, the Yellow line represents the larger-scale volatility average.
the Blue line represents more recent volatility and the Pink lien represents the very recent average.
Using this indicator is possible in a number of ways:
If volatility is high and directional, you will see a sharp increase in the Pink line.
If volatility is high and choppy, the Pink line will be well above the Blue line and will oscillate up and down.
If volatility is starting to cool down, the Pink line will approach the Blue and Yellow lines.
Open-source script
In true TradingView spirit, the creator of this script has made it open-source, so that traders can review and verify its functionality. Kudos to the author! While you can use it for free, remember that republishing the code is subject to our House Rules.
Disclaimer
The information and publications are not meant to be, and do not constitute, financial, investment, trading, or other types of advice or recommendations supplied or endorsed by TradingView. Read more in the Terms of Use.