OPEN-SOURCE SCRIPT
Updated Seasonal Performance for Stocks & Crypto
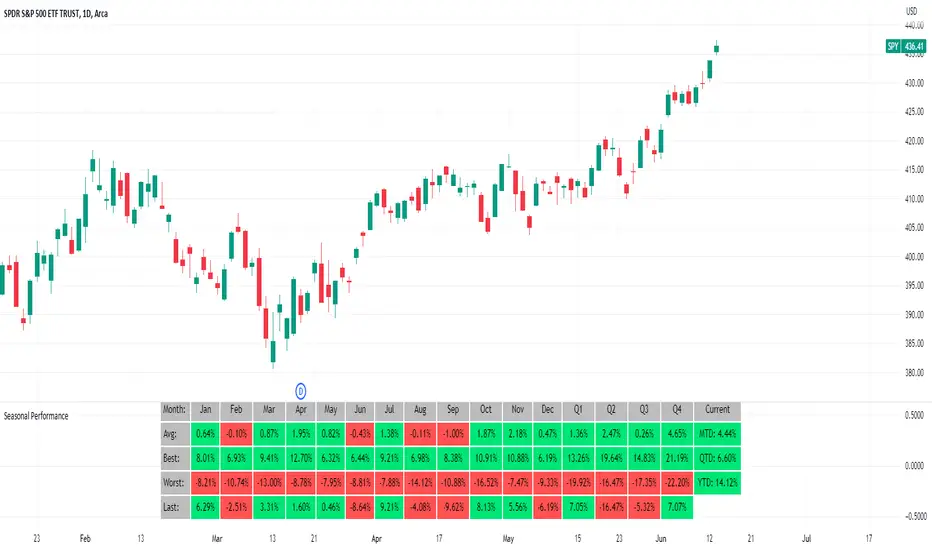
The Seasonal Performance indicator quickly allows you to see if you are in a bullish or bearish time of year for an underlying security and where the current performance stacks up compared to the same time of year historically. Table is fully customizable from colors to what data to see.
Table Displays
Note this indicator will only work with Stocks, ETF's, Index's or Crypto.
Table Displays
- Average Performance
- Best Performance
- Worst Performance
- Last Performance
- Current Performance
Note this indicator will only work with Stocks, ETF's, Index's or Crypto.
Release Notes
Added ability to see the number of times each month or quarter was bullish or bearishOpen-source script
In true TradingView spirit, the creator of this script has made it open-source, so that traders can review and verify its functionality. Kudos to the author! While you can use it for free, remember that republishing the code is subject to our House Rules.
Trusted Pine programmer. Send me a message for script development.
Disclaimer
The information and publications are not meant to be, and do not constitute, financial, investment, trading, or other types of advice or recommendations supplied or endorsed by TradingView. Read more in the Terms of Use.
Open-source script
In true TradingView spirit, the creator of this script has made it open-source, so that traders can review and verify its functionality. Kudos to the author! While you can use it for free, remember that republishing the code is subject to our House Rules.
Trusted Pine programmer. Send me a message for script development.
Disclaimer
The information and publications are not meant to be, and do not constitute, financial, investment, trading, or other types of advice or recommendations supplied or endorsed by TradingView. Read more in the Terms of Use.