OPEN-SOURCE SCRIPT
Support line based on RSI
This indicator builds a support line using the stock price and RSI.
Inputs:
1. Time window for the RSI:
the time window the RSI is calculated with, usually it's 14 but in here I recommend 30.
2. offset by percentage:
just adding or subtructing some percentage of the result, some stocks need a bit of offset to work
3. stability:
the higher it is the less the RSI effects the graph. for realy high stability the indicator the the stock price will be realy close.
formula: (close*(100-newRSI)/50)*(100+offset)/100
when:
newRSI = (RSI + (50 * stability1))/(stability+1)
recommended usage:
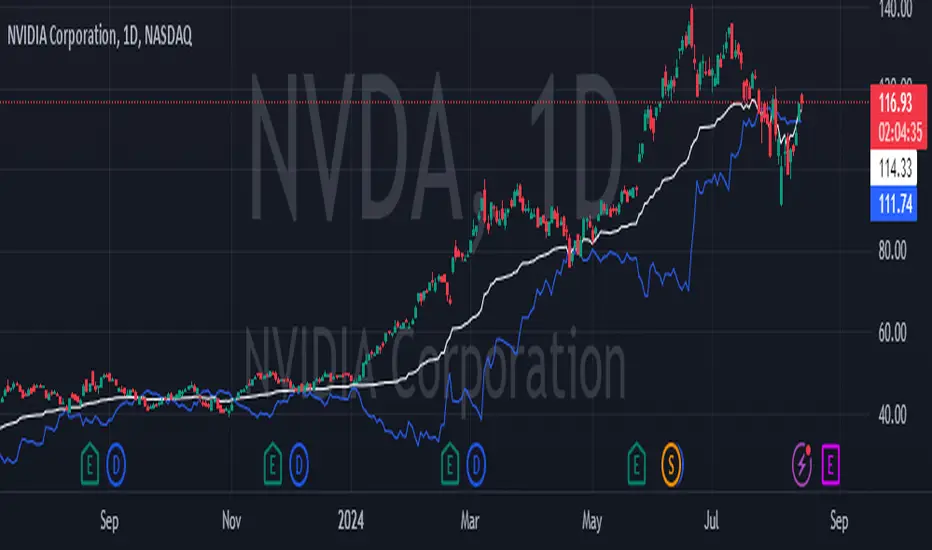
Usually, if the indicator becomes higher than the price, (the price lowers). the stock will go up again to around the last price where they met.
so, for example, if the stock price was 20 and going down. while the indicator was 18 and going up, then they met at 19 and later the indicator became 20 while the stock fell to 18. most chances are that the stock will come back to 19 where they met and at the same time the indicator will also get to 19.
In stocks that are unstable, like NVDA. this indicator can be used to see the trend and avoid the unstability of the stock.
Inputs:
1. Time window for the RSI:
the time window the RSI is calculated with, usually it's 14 but in here I recommend 30.
2. offset by percentage:
just adding or subtructing some percentage of the result, some stocks need a bit of offset to work
3. stability:
the higher it is the less the RSI effects the graph. for realy high stability the indicator the the stock price will be realy close.
formula: (close*(100-newRSI)/50)*(100+offset)/100
when:
newRSI = (RSI + (50 * stability1))/(stability+1)
recommended usage:
Usually, if the indicator becomes higher than the price, (the price lowers). the stock will go up again to around the last price where they met.
so, for example, if the stock price was 20 and going down. while the indicator was 18 and going up, then they met at 19 and later the indicator became 20 while the stock fell to 18. most chances are that the stock will come back to 19 where they met and at the same time the indicator will also get to 19.
In stocks that are unstable, like NVDA. this indicator can be used to see the trend and avoid the unstability of the stock.
Open-source script
In true TradingView spirit, the creator of this script has made it open-source, so that traders can review and verify its functionality. Kudos to the author! While you can use it for free, remember that republishing the code is subject to our House Rules.
Disclaimer
The information and publications are not meant to be, and do not constitute, financial, investment, trading, or other types of advice or recommendations supplied or endorsed by TradingView. Read more in the Terms of Use.