PROTECTED SOURCE SCRIPT
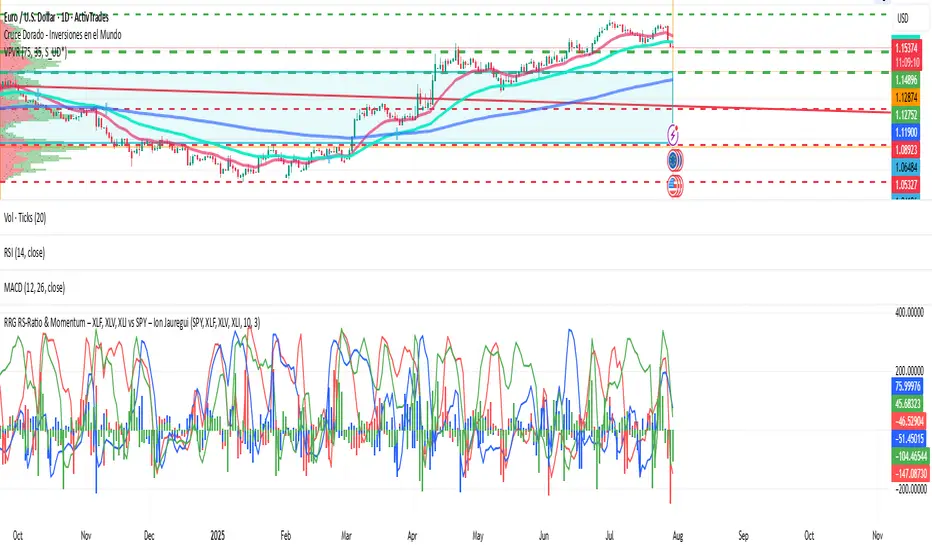
RRG RS-Ratio & Momentum – XLF, XLV, XLI vs SPY – Ion Jauregui
RRG RS-Ratio & Momentum – XLF, XLV, XLI vs SPY – Ion Jauregui
📘 What does this script do?
This indicator simulates a Relative Rotation Graph (RRG), analyzing the sector rotation of three major U.S. market ETFs:
🟥 XLF – Financial Sector
🟦 XLV – Health Care Sector
🟩 XLI – Industrial Sector
Each is compared against SPY (S&P 500 ETF) as the benchmark.
⚙️ How does it work?
The script calculates two key RRG components:
RS-Ratio (Relative Strength Ratio):
Measures the strength of each sector relative to SPY.
Momentum of RS-Ratio:
Measures the change in RS-Ratio, helping to visualize rotation speed and direction.
These are computed using smoothed relative strength ratios and standard deviation over a user-defined period.
📈 What does it plot?
Colored lines representing the RS-Ratio of each sector versus SPY:
🔴 XLF (Financials)
🔵 XLV (Health Care)
🟢 XLI (Industrials)
Optionally, you can display Momentum as bar charts in a separate panel.
🧩 How to interpret the chart?
This tool helps visualize where each sector is in its relative strength cycle:
📈 Rising RS-Ratio + Positive Momentum → Sector is leading
📉 Falling RS-Ratio + Negative Momentum → Sector is weakening
Momentum shifts often signal early rotations before RS-Ratio reversals
🛠 Technical details:
Compatible with any timeframe (daily or weekly recommended)
🖊 Author:
Ion Jauregui – Analyst at ActivTrades
Designed to provide a visual and accessible approach to sector rotation versus SPY.
*******************************************************************************************
The information provided does not constitute investment research. The material has not been prepared in accordance with the legal requirements designed to promote the independence of investment research and such should be considered a marketing communication.
All information has been prepared by ActivTrades ("AT"). The information does not contain a record of AT's prices, or an offer of or solicitation for a transaction in any financial instrument. No representation or warranty is given as to the accuracy or completeness of this information.
Any material provided does not have regard to the specific investment objective and financial situation of any person who may receive it. Past performance and forecasting are not a synonym of a reliable indicator of future performance. AT provides an execution-only service. Consequently, any person acting on the information provided does so at their own risk. Political risk is unpredictable. Central bank actions can vary. Platform tools do not guarantee success.
INDICATORS RISK ADVICE: The information and publications are not meant to be, and do not constitute, financial, investment, trading, or other types of advice or recommendations supplied or endorsed by ActivTrades. This script intends to help follow the trend and filter out market noise. This script is meant for the use of international users. This script is not meant for the use of Spain users.
📘 What does this script do?
This indicator simulates a Relative Rotation Graph (RRG), analyzing the sector rotation of three major U.S. market ETFs:
🟥 XLF – Financial Sector
🟦 XLV – Health Care Sector
🟩 XLI – Industrial Sector
Each is compared against SPY (S&P 500 ETF) as the benchmark.
⚙️ How does it work?
The script calculates two key RRG components:
RS-Ratio (Relative Strength Ratio):
Measures the strength of each sector relative to SPY.
- Values above 100 = outperforming SPY
- Values below 100 = underperforming SPY
Momentum of RS-Ratio:
Measures the change in RS-Ratio, helping to visualize rotation speed and direction.
These are computed using smoothed relative strength ratios and standard deviation over a user-defined period.
📈 What does it plot?
Colored lines representing the RS-Ratio of each sector versus SPY:
🔴 XLF (Financials)
🔵 XLV (Health Care)
🟢 XLI (Industrials)
Optionally, you can display Momentum as bar charts in a separate panel.
🧩 How to interpret the chart?
This tool helps visualize where each sector is in its relative strength cycle:
📈 Rising RS-Ratio + Positive Momentum → Sector is leading
📉 Falling RS-Ratio + Negative Momentum → Sector is weakening
Momentum shifts often signal early rotations before RS-Ratio reversals
🛠 Technical details:
Compatible with any timeframe (daily or weekly recommended)
🖊 Author:
Ion Jauregui – Analyst at ActivTrades
Designed to provide a visual and accessible approach to sector rotation versus SPY.
*******************************************************************************************
The information provided does not constitute investment research. The material has not been prepared in accordance with the legal requirements designed to promote the independence of investment research and such should be considered a marketing communication.
All information has been prepared by ActivTrades ("AT"). The information does not contain a record of AT's prices, or an offer of or solicitation for a transaction in any financial instrument. No representation or warranty is given as to the accuracy or completeness of this information.
Any material provided does not have regard to the specific investment objective and financial situation of any person who may receive it. Past performance and forecasting are not a synonym of a reliable indicator of future performance. AT provides an execution-only service. Consequently, any person acting on the information provided does so at their own risk. Political risk is unpredictable. Central bank actions can vary. Platform tools do not guarantee success.
INDICATORS RISK ADVICE: The information and publications are not meant to be, and do not constitute, financial, investment, trading, or other types of advice or recommendations supplied or endorsed by ActivTrades. This script intends to help follow the trend and filter out market noise. This script is meant for the use of international users. This script is not meant for the use of Spain users.
Protected script
This script is published as closed-source. However, you can use it freely and without any limitations – learn more here.
Disclaimer
The information and publications are not meant to be, and do not constitute, financial, investment, trading, or other types of advice or recommendations supplied or endorsed by TradingView. Read more in the Terms of Use.