OPEN-SOURCE SCRIPT
Market Clarity Pro
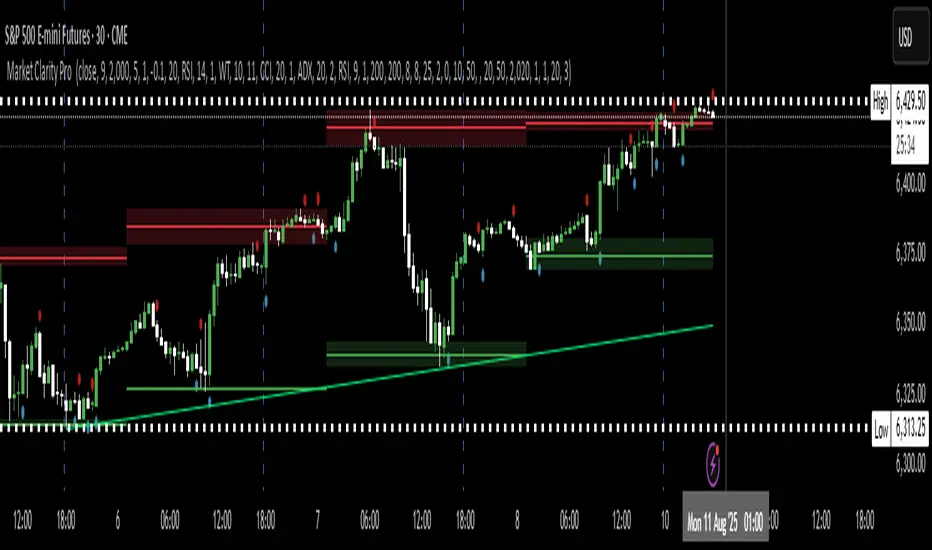
Market Clarity Pro — See Key Zones, Trend & Volume Signals
Spot yesterday’s High (Supply) and Low (Demand) instantly — and know exactly where big buyers and sellers are likely waiting.
Red zones = strong selling pressure.
Green zones = strong buying pressure.
Plus, a built-in trend line keeps you trading in the right direction and away from sudden reversals.
You’ll also see:
🔴 Red arrow — not a sell signal, but a sign of heavy sellers stepping in, with volume confirmation and a candle breaking the previous one.
🔵 Blue arrow — not a buy signal, but a sign of strong buyers stepping in, with volume confirmation and a candle breaking the previous one.
These arrows highlight potential volume spikes and breakouts for confirmation only — you still confirm with the higher time frame for more market clarity.
Break above supply. Possible uptrend.
Break below demand. Possible downtrend.
📌 Before using this tool, watch the tutorial video to learn exactly how to apply it and how to spot profitable trades with confidence.
Open-source script
In true TradingView spirit, the creator of this script has made it open-source, so that traders can review and verify its functionality. Kudos to the author! While you can use it for free, remember that republishing the code is subject to our House Rules.
Disclaimer
The information and publications are not meant to be, and do not constitute, financial, investment, trading, or other types of advice or recommendations supplied or endorsed by TradingView. Read more in the Terms of Use.