OPEN-SOURCE SCRIPT
Momentum Oscillator - Column Plot
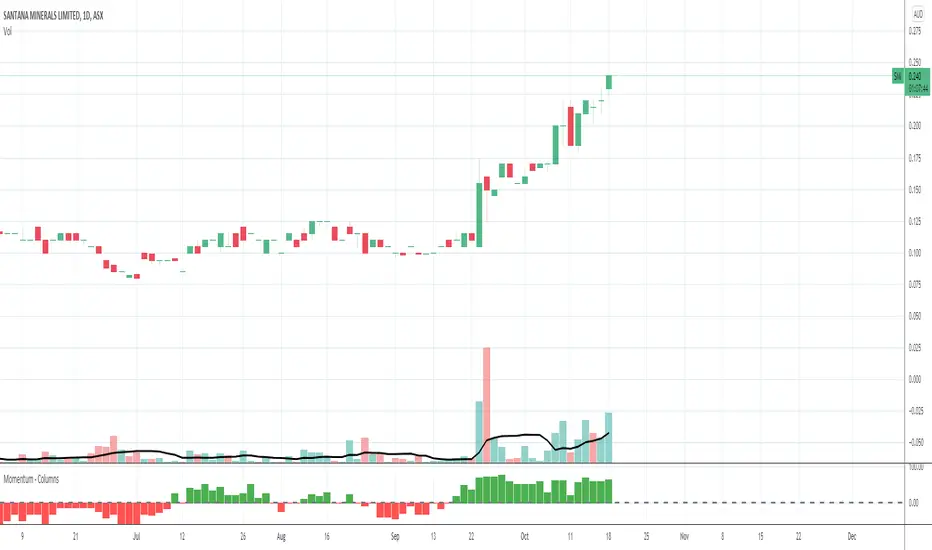
This script is based on the existing Momentum Indicator which shows whether the underlying percentage change in closing price is positive or negative.
This script however uses columns to plot the change and shows this as green for >0 change, and red for <0.
This script however uses columns to plot the change and shows this as green for >0 change, and red for <0.
Open-source script
In true TradingView spirit, the creator of this script has made it open-source, so that traders can review and verify its functionality. Kudos to the author! While you can use it for free, remember that republishing the code is subject to our House Rules.
Disclaimer
The information and publications are not meant to be, and do not constitute, financial, investment, trading, or other types of advice or recommendations supplied or endorsed by TradingView. Read more in the Terms of Use.