OPEN-SOURCE SCRIPT
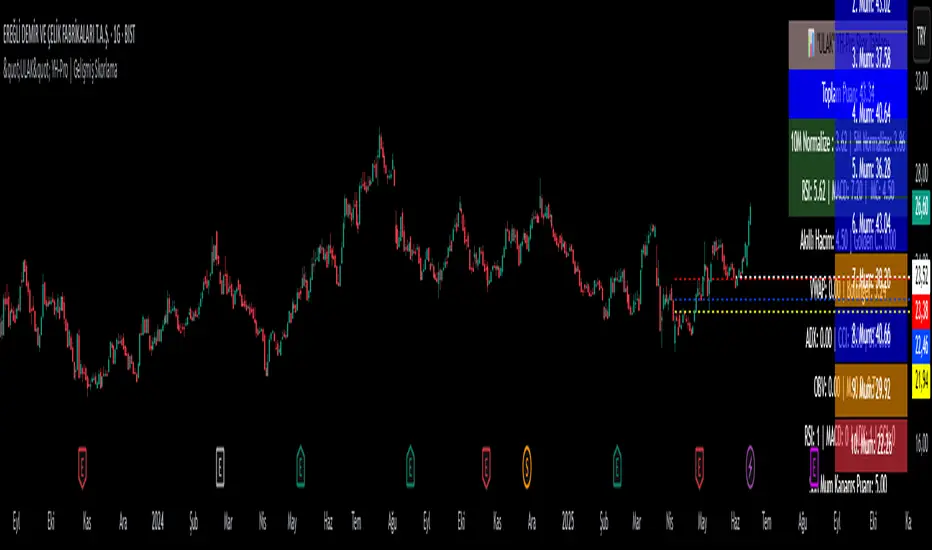
Updated "ULAK" YH-Pro | Gelişmiş Skorlama
This code is constantly being updated.
The total score is calculated by scoring different indicators.
The total score is calculated by scoring different indicators.
Release Notes
Advanced Smart Volume ScoreA weighted and normalized volume scoring system was added, considering volume changes, price movement, volatility, RSI, and price trend. This allows for more precise measurement of volume effects on market dynamics.
Price Average and Trend Scoring
The indicator scores the price position relative to 50, 100, and 150-period moving averages, adding positive or negative contributions to the overall score based on trend alignment.
Normalized Scores and Limits
Scores are normalized and capped within defined ranges (e.g., 0–20 or 0–15), preventing excessive values and ensuring consistent comparisons.
Moving Average of Scores
The indicator calculates 5-day and 21-day moving averages of the scores to analyze short and mid-term volume performance and trend strength.
Release Notes
Update: Monte Carlo SimulationPurpose of the Monte Carlo Simulation Scoring
The main objective of this indicator is to simulate possible future price paths using statistical randomness and generate a composite score (0–10) that reflects the strength, risk, and direction of the asset based on these simulations. This score helps traders gauge whether a stock is likely to rise, how risky that rise may be, and if the simulation agrees with the current trend.
Simulation Mechanics
The script runs 100 Monte Carlo simulations into the future (10 bars ahead). Each simulation path is generated using:
Historical log returns from the past 30 bars,
Calculated mean return and standard deviation (volatility),
The Box-Muller transform to create normally distributed random shocks.
Each simulation outputs a potential future price, from which statistical insights are drawn.
Key Statistical Metrics Used
The following metrics are extracted from the simulations:
Mean Return Score: Normalized using z-score and sigmoid; reflects expected growth.
Risk Score: Based on the standard deviation of simulation outcomes, with lower risk yielding higher scores.
Bull Probability Score: Measures how many simulations end higher than the current price; normalized via sigmoid.
Trend Match Score: Compares the regression slope of recent prices with the simulation direction.
These metrics are weighted and combined to compute the final Monte Carlo score.
Final Score Calculation
The total Monte Carlo score is computed as:
matlab
Kopyala
Düzenle
Total Score =
40% Mean Return Score +
20% Risk Score +
20% Bullish Probability Score +
20% Trend Match Score
The result is clamped between 0 and 10, ensuring standardized output for integration with other systems.
Use Cases and Integration Potential
This score can be used to:
Identify statistically favorable setups,
Filter out high-risk or low-potential symbols,
Combine with other scoring models (e.g., RSI, MACD, volume) in a multi-factor system,
Trigger alerts when the Monte Carlo score exceeds a threshold (e.g., >7).
This modular structure makes it ideal for comprehensive market scanners or smart trade decision systems.
Release Notes
The error in smart volume has been fixed.Release Notes
The error in smart volume has been fixed.Release Notes
The error in smart volume has been fixed.Release Notes
The error in smart volume has been fixed.Release Notes
Momentum errors correctedRelease Notes
Buy Signal and Drop Risk sensitivities have been added.Estimated rise time calculation has been added.
Some bugs have been fixed...
Release Notes
The forecast has been updated.Release Notes
Data entry and alert condition added for estimated percentage increaseOpen-source script
In true TradingView spirit, the creator of this script has made it open-source, so that traders can review and verify its functionality. Kudos to the author! While you can use it for free, remember that republishing the code is subject to our House Rules.
Disclaimer
The information and publications are not meant to be, and do not constitute, financial, investment, trading, or other types of advice or recommendations supplied or endorsed by TradingView. Read more in the Terms of Use.
Open-source script
In true TradingView spirit, the creator of this script has made it open-source, so that traders can review and verify its functionality. Kudos to the author! While you can use it for free, remember that republishing the code is subject to our House Rules.
Disclaimer
The information and publications are not meant to be, and do not constitute, financial, investment, trading, or other types of advice or recommendations supplied or endorsed by TradingView. Read more in the Terms of Use.