OPEN-SOURCE SCRIPT
Absolute High and Low {Darkoexe}
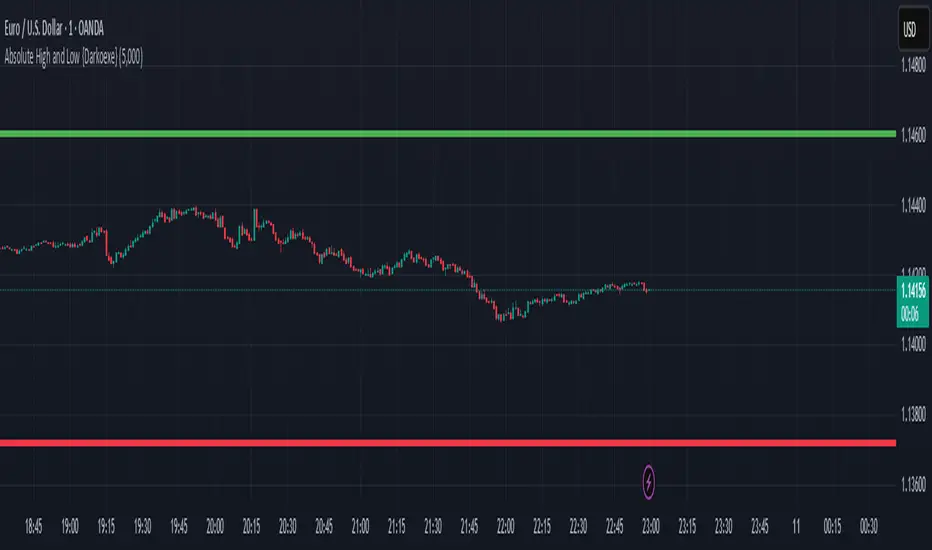
This indicator identifies and visually highlights the absolute highest and lowest closing prices on a chart. It is designed to help traders quickly recognize major price extremes that can serve as significant support/resistance levels or turning points in historical price action.
🔧 What It Does
The script plots persistent horizontal lines on your chart to mark either:
The absolute highest and lowest closing prices of the entire visible chart, or
The highest and lowest closing prices within a custom range of candles, defined by the user.
These price levels are plotted using thick green and red lines, respectively, and are updated dynamically as new highs or lows are set.
⚙️ How It Works
When “Use all candles” is enabled, the script continuously updates the high and low lines based on the full price history of the chart. These lines remain until a new extreme is made.
When disabled, the script checks only the most recent N candles (max bars back input). It scans this window to find and plot the highest and lowest closes.
The lines extend to the right to help users visually anchor these key levels in future price action.
🎯 Use Cases
Spotting extreme price levels for potential mean-reversion strategies.
Confirming breakout or breakdown conditions.
Defining long-term support and resistance zones.
This tool is especially useful for discretionary traders who value historical context and want clear visual markers for past price extremes.
⚠️ Notes and Limitations
This script is not predictive. It simply marks historical price extremes based on closing values.
When using the fixed range mode (max bars back), be aware that values outside this range will not be considered.
The indicator does not repaint, but in full chart mode, it updates only when a new extreme is formed.
Open-source script
In true TradingView spirit, the creator of this script has made it open-source, so that traders can review and verify its functionality. Kudos to the author! While you can use it for free, remember that republishing the code is subject to our House Rules.
Disclaimer
The information and publications are not meant to be, and do not constitute, financial, investment, trading, or other types of advice or recommendations supplied or endorsed by TradingView. Read more in the Terms of Use.