OPEN-SOURCE SCRIPT
JSE Market Breadth Stocks>MA
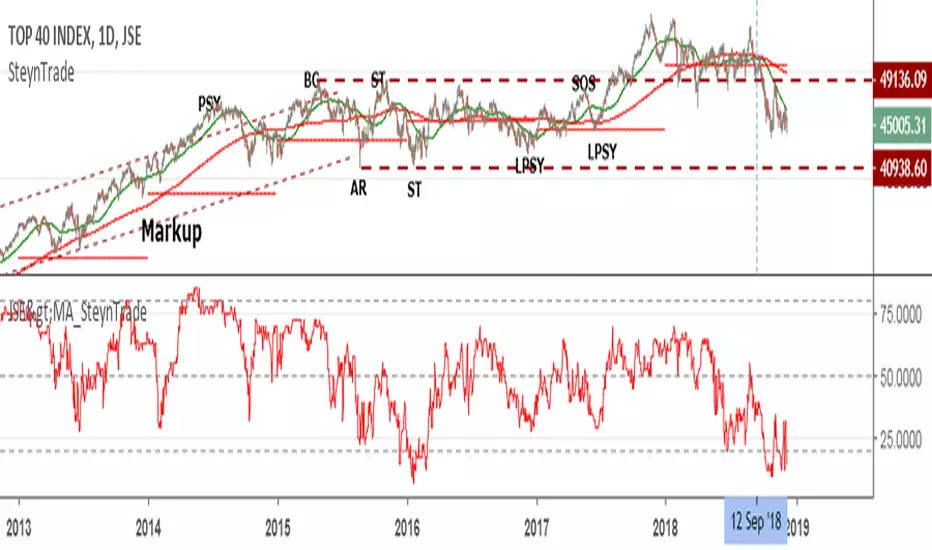
This indicator is for the Johannesburg Stock Exchange (JSE) and indicates the number of stocks in the Top 40 Index above its selected Smooth Moving Average (SMA). Typically the 200SMA is used to see the longer term health of the market and the 50SMA for a short term view. Currently the market has reached a point that less than 2% of stocks were above their 200SMA which is the lowest since 2013.
Open-source script
In true TradingView spirit, the creator of this script has made it open-source, so that traders can review and verify its functionality. Kudos to the author! While you can use it for free, remember that republishing the code is subject to our House Rules.
Disclaimer
The information and publications are not meant to be, and do not constitute, financial, investment, trading, or other types of advice or recommendations supplied or endorsed by TradingView. Read more in the Terms of Use.