OPEN-SOURCE SCRIPT
Previous High/Low Range (D,W,M)
Previous High/Low Range (D,W,M)
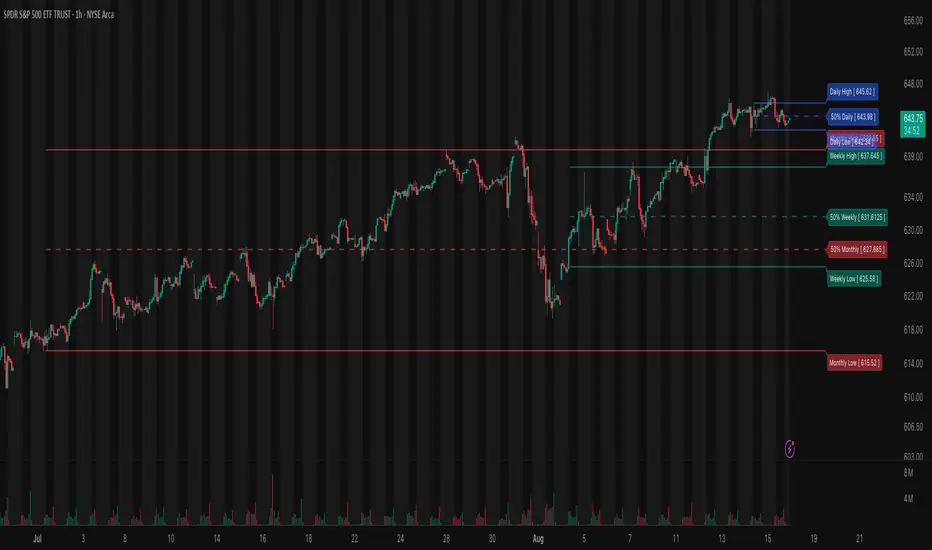
This indicator displays the previous period’s High, Low, and 50% Midpoint levels for the Day, Week, and Month. It visually extends these levels into the future for easy reference, helping traders identify key support and resistance zones. Users can customize the visibility, colors, and line styles for each timeframe, and optionally show labels and a dashed midpoint line for clearer analysis. Ideal for trend analysis and spotting potential reversal points.
This indicator displays the previous period’s High, Low, and 50% Midpoint levels for the Day, Week, and Month. It visually extends these levels into the future for easy reference, helping traders identify key support and resistance zones. Users can customize the visibility, colors, and line styles for each timeframe, and optionally show labels and a dashed midpoint line for clearer analysis. Ideal for trend analysis and spotting potential reversal points.
Open-source script
In true TradingView spirit, the creator of this script has made it open-source, so that traders can review and verify its functionality. Kudos to the author! While you can use it for free, remember that republishing the code is subject to our House Rules.
Disclaimer
The information and publications are not meant to be, and do not constitute, financial, investment, trading, or other types of advice or recommendations supplied or endorsed by TradingView. Read more in the Terms of Use.