OPEN-SOURCE SCRIPT
Updated Fractal Helper
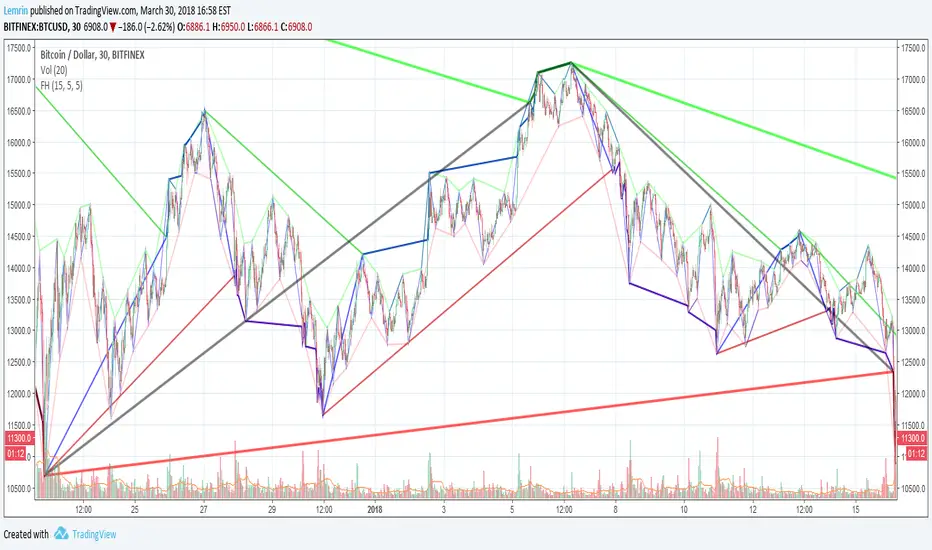
A spinoff from a previous script I published, this configurable indicator also selects highs and lows and then plots a trend line that bounces between them. In addition, it also iterates this up to two more times in a quasi-fractal manner, on larger time scales, and plots them on the same graph.
Of course this will not spit out Elliott waves, but with adjusting, it could aid in discerning one wave from another.
I may experiment with the security function again to get a better, longer L3 plot, although charts are limited in duration anyway.


Of course this will not spit out Elliott waves, but with adjusting, it could aid in discerning one wave from another.
I may experiment with the security function again to get a better, longer L3 plot, although charts are limited in duration anyway.
Release Notes
Made L2 and L3 trends reference high/low, not previous level's extreme points (and na values).Open-source script
In true TradingView spirit, the creator of this script has made it open-source, so that traders can review and verify its functionality. Kudos to the author! While you can use it for free, remember that republishing the code is subject to our House Rules.
Disclaimer
The information and publications are not meant to be, and do not constitute, financial, investment, trading, or other types of advice or recommendations supplied or endorsed by TradingView. Read more in the Terms of Use.
Open-source script
In true TradingView spirit, the creator of this script has made it open-source, so that traders can review and verify its functionality. Kudos to the author! While you can use it for free, remember that republishing the code is subject to our House Rules.
Disclaimer
The information and publications are not meant to be, and do not constitute, financial, investment, trading, or other types of advice or recommendations supplied or endorsed by TradingView. Read more in the Terms of Use.