OPEN-SOURCE SCRIPT
Double Bollinger Bands
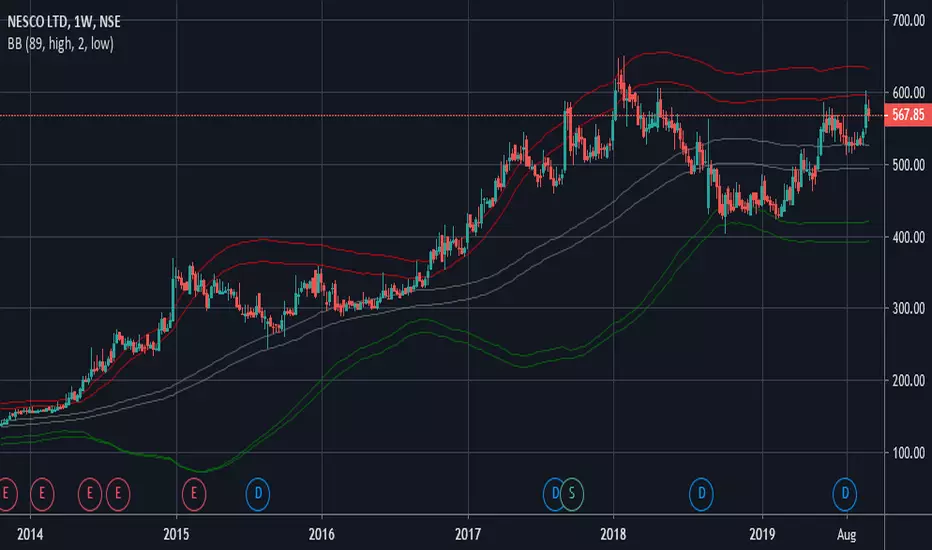
On fundamentally strong stocks for entry points. The area in the Gray lines is the best one to enter and reasonable valuation. The area in the Red lines indicates higher Valuation. The area in the Green lines indicates lower Valuation and better to be careful and avoid.
Open-source script
In true TradingView spirit, the creator of this script has made it open-source, so that traders can review and verify its functionality. Kudos to the author! While you can use it for free, remember that republishing the code is subject to our House Rules.
Disclaimer
The information and publications are not meant to be, and do not constitute, financial, investment, trading, or other types of advice or recommendations supplied or endorsed by TradingView. Read more in the Terms of Use.