OPEN-SOURCE SCRIPT
MS CRB/SPY
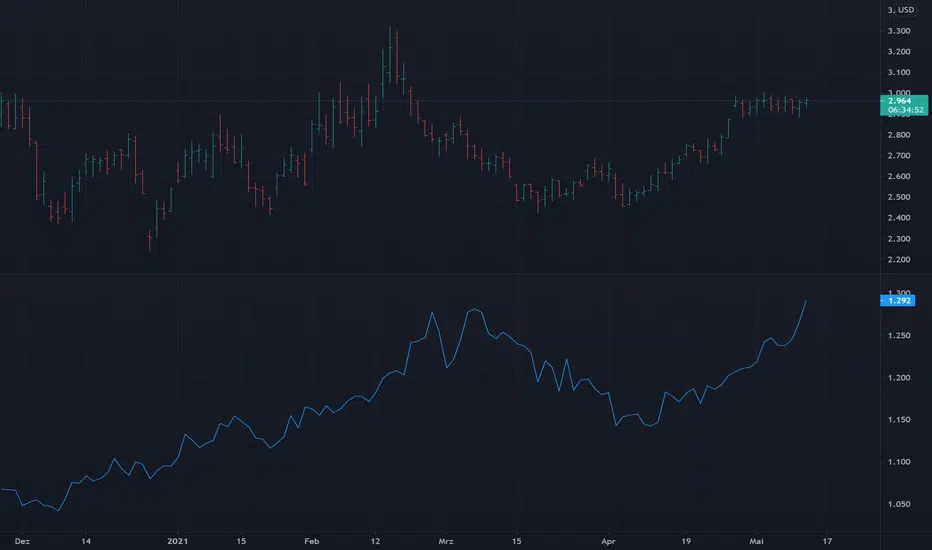
This indicator tracks the GSCI Commodity Index over the course of the S&P 500. This is used for the fundamental evaluation of ratios of asset classes to each other. The thesis is based on Ray Dalio's quadrant theory: in periods without inflation and with good growth, stock prices rise and commodity prices fall. Conversely, in periods of good growth in an inflationary environment, commodities rise and the rise in equities slows. In particular, there is a change of favorites towards companies that produce cash (i.e. away from growth fantasies). This indicator shows the change in valuations between asset classes and thus allows conclusions to be drawn. This still goes far beyond what has been written, I recommend reading Ray Dalio's works on this.
Open-source script
In true TradingView spirit, the creator of this script has made it open-source, so that traders can review and verify its functionality. Kudos to the author! While you can use it for free, remember that republishing the code is subject to our House Rules.
Disclaimer
The information and publications are not meant to be, and do not constitute, financial, investment, trading, or other types of advice or recommendations supplied or endorsed by TradingView. Read more in the Terms of Use.