OPEN-SOURCE SCRIPT
Updated Zig Zag Stochastic (ZZS)
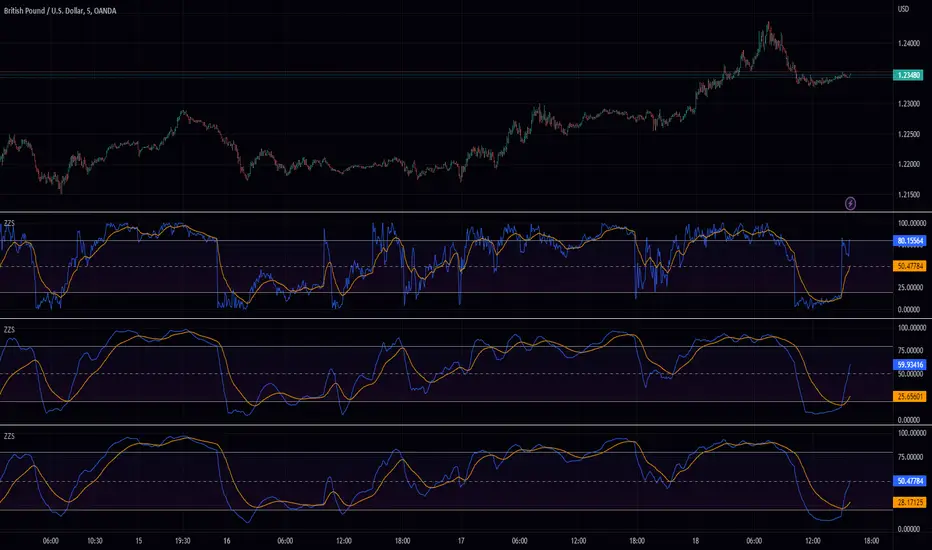
The "Zig Zag Stochastic" indicator is an indicator that uses a combination of zigzag pivot points and exponential smoothing to calculate a stochastic-like oscillator.
The indicator starts by identifying pivot high and pivot low points in the price data using the Zigzag indicator. These pivot points are then used to calculate the scale_price, which is a ratio of the current close price to the range between the current pivot high and pivot low.
Next, the scale_price is smoothed using exponential smoothing. The user can input the desired length of the smoothing period, with a default value of 14. If the user sets the smoothing length to 0, the indicator will automatically calculate the optimal smoothing length using the MAMA period calculation from the Dominant Cycle Estimators library.
The smoothed scale_price is then used to calculate two lines: the K-line and the D-line, both of which are also smoothed using exponential smoothing. The K-line is the main oscillator line and is similar to the %K line in a traditional stochastic oscillator. The D-line is a signal line, similar to the %D line in a traditional stochastic oscillator.
The indicator plots the smoothed scale_price, the K-line, and the D-line. Additionally, it includes horizontal lines at the 80 and 20 levels, and fills the area between them to help identify overbought and oversold conditions.
Release Notes
chart fixOpen-source script
In true TradingView spirit, the creator of this script has made it open-source, so that traders can review and verify its functionality. Kudos to the author! While you can use it for free, remember that republishing the code is subject to our House Rules.
Here are some ways you can contact me:
Toll-Free: +1(800)250-1992
Discord: hikari0001
Telegram: t.me/Jessesanford
Email: info@peaceful.trade
Toll-Free: +1(800)250-1992
Discord: hikari0001
Telegram: t.me/Jessesanford
Email: info@peaceful.trade
Disclaimer
The information and publications are not meant to be, and do not constitute, financial, investment, trading, or other types of advice or recommendations supplied or endorsed by TradingView. Read more in the Terms of Use.
Open-source script
In true TradingView spirit, the creator of this script has made it open-source, so that traders can review and verify its functionality. Kudos to the author! While you can use it for free, remember that republishing the code is subject to our House Rules.
Here are some ways you can contact me:
Toll-Free: +1(800)250-1992
Discord: hikari0001
Telegram: t.me/Jessesanford
Email: info@peaceful.trade
Toll-Free: +1(800)250-1992
Discord: hikari0001
Telegram: t.me/Jessesanford
Email: info@peaceful.trade
Disclaimer
The information and publications are not meant to be, and do not constitute, financial, investment, trading, or other types of advice or recommendations supplied or endorsed by TradingView. Read more in the Terms of Use.