OPEN-SOURCE SCRIPT
Double Bollinger Strategy
From "Bitcoin Trading Strategies: Algorithmic Trading Strategies For Bitcoin And Cryptocurrency That Work" by David Hanson.
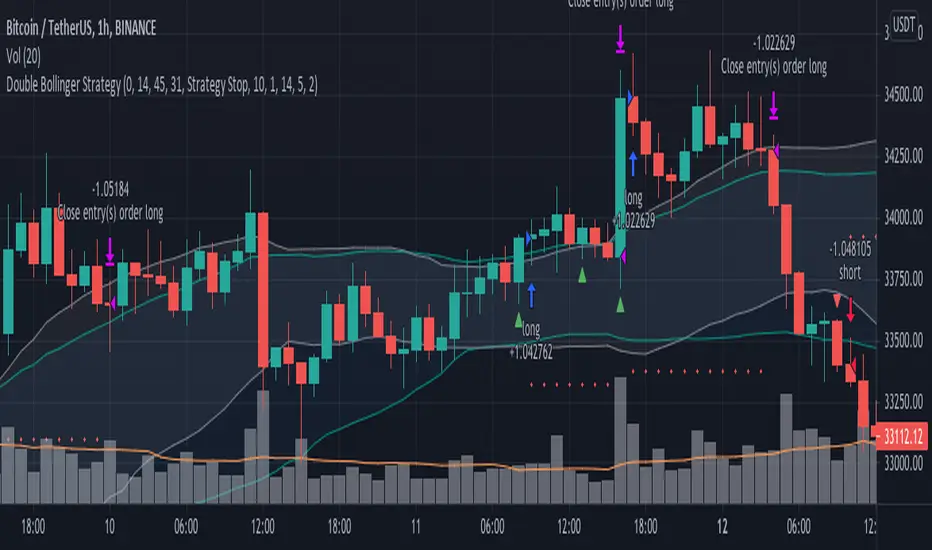
*Works better with 1hr time frame and some input optimisations.
"Double Bollinger Band Scalping System
Recommended Timeframe: 1 minute or 5 minute *
Required Indicators:
// - RSI with a length of 14 (default settings)
// - Bollinger band #1 settings: Length = 50, stDev = 1 Hide the basis/middle line (basis line not needed for this strategy)
Note: This is the slower bollinger band in the directions
// - Bollinger band #2 settings: Length 20, stDev = 1 Hide the basis/middle line (basis line not needed for this strategy)
Note: This is the faster bollinger band in the directions
Enter Long/Buy Trade When:
// - RSI is above the level 50
// - A candle closes above the top of the faster bollinger band
Enter a long when a candle then closes above the top of the slower bollinger band, and price is above the top of both bands
Place a stop loss under the low of the entry candle Example of a long trade using this strategy
Exit Long Trade When: A candle closes below the top band of the fast bollinger band
Enter Short/Sell Trade When:
// - RSI is below the level 50
// - A candle closes below the bottom of the faster bollinger band
Enter a short when a candle then closes below the bottom of the slower bollinger band, and price is below both bands
Place a stop loss above the high of the entry candle Example of a short trade using this strategy
Exit Short Trade When: Price closes inside the bottom of the faster bollinger band"
Open-source script
In true TradingView spirit, the creator of this script has made it open-source, so that traders can review and verify its functionality. Kudos to the author! While you can use it for free, remember that republishing the code is subject to our House Rules.
Disclaimer
The information and publications are not meant to be, and do not constitute, financial, investment, trading, or other types of advice or recommendations supplied or endorsed by TradingView. Read more in the Terms of Use.