OPEN-SOURCE SCRIPT
Bitcoin Power Law Model
Bitcoin Power Law Model with Cycle Predictions
Scientific Price Modeling for Bitcoin
This indicator implements **Dr. Giovanni Santostasi's Bitcoin Power Law Theory** - a discovery that Bitcoin's price follows mathematical laws similar to natural phenomena. Unlike traditional financial models, this treats Bitcoin as a scale-invariant system that grows predictably over time.
What Makes This Special
Dr. Santostasi, an astrophysicist who studied gravitational waves, discovered that Bitcoin's price forms a perfect straight line when plotted on a log-log scale over its entire 15-year history. This isn't just another technical indicator - it's a fundamental law that has held true through multiple 80%+ crashes and recoveries.
Core Features
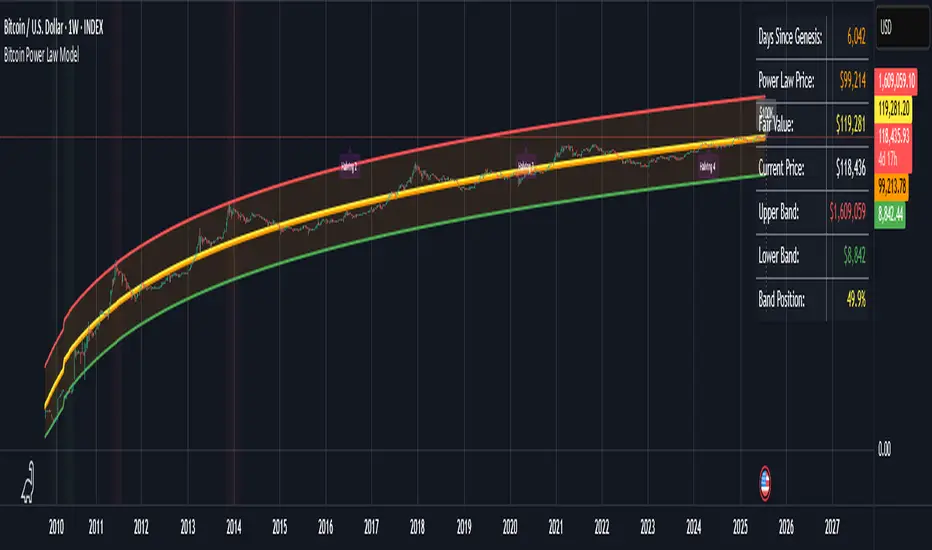
Power Law Model
- Orange Line: The power law trajectory showing Bitcoin's long-term growth path
- Yellow Line: Fair value (geometric mean between support and resistance)
- Green/Red Bands: Support and resistance levels that have historically contained price movements
- Band Position %: Shows exactly where price sits within the power law channel (0-100%)
How to Use It
For Long-term Investors
1. Accumulate when price is near the green support line (band position < 20%)
2. Hold when price is between the bands
3. Consider profits when approaching red resistance (band position > 80%)
4. Never panic - the model shows $30K+ is now the permanent floor
Key Metrics to Watch
- **Band Position: <20% = Oversold, >80% = Overbought
- Fair Value: Price above = Overvalued, below = Undervalued
- Support Line: Breaking below suggests model invalidation
Current Cycle Projections
Based on the November 2022 bottom at ~$15,500:
- Cycle Peak: ~$155,000-$230,000 (October 2025)
- Next Bottom: ~$70,000-$100,000 (October 2026)
- Long-term: $1 million by 2033 (power law projection)
Customizable Settings
Model Parameters
- Intercept & Slope: Fine-tune the power law formula
- Band Offsets: Adjust support/resistance distances
Display Options
- Toggle each visual element on/off
- Show/hide future projections
- Enable/disable cycle analysis
- Customize halving markers
Understanding the Math
The model uses the formula: **Price = 10^(A + B × log10(days since genesis))**
Where:
- A = -17.01 (intercept)
- B = 5.82 (slope)
- Days counted from Bitcoin's genesis block (Jan 3, 2009)
This creates parallel support/resistance lines in log-log space that have contained Bitcoin's price for 15+ years.
Important
1.Not Financial Advice: This is a mathematical model, not a guarantee
2. Long-term Focus: Best suited for macro analysis, not day trading
3. Model Limitations: Past performance doesn't ensure future results
4. Volatility Expected: 50-80% drawdowns are normal within the model
Background
Dr. Giovanni Santostasi discovered this model while analyzing Bitcoin through the lens of physics. He found that Bitcoin behaves more like a city or organism than a financial asset, growing according to universal power laws found throughout
Scientific Price Modeling for Bitcoin
This indicator implements **Dr. Giovanni Santostasi's Bitcoin Power Law Theory** - a discovery that Bitcoin's price follows mathematical laws similar to natural phenomena. Unlike traditional financial models, this treats Bitcoin as a scale-invariant system that grows predictably over time.
What Makes This Special
Dr. Santostasi, an astrophysicist who studied gravitational waves, discovered that Bitcoin's price forms a perfect straight line when plotted on a log-log scale over its entire 15-year history. This isn't just another technical indicator - it's a fundamental law that has held true through multiple 80%+ crashes and recoveries.
Core Features
Power Law Model
- Orange Line: The power law trajectory showing Bitcoin's long-term growth path
- Yellow Line: Fair value (geometric mean between support and resistance)
- Green/Red Bands: Support and resistance levels that have historically contained price movements
- Band Position %: Shows exactly where price sits within the power law channel (0-100%)
How to Use It
For Long-term Investors
1. Accumulate when price is near the green support line (band position < 20%)
2. Hold when price is between the bands
3. Consider profits when approaching red resistance (band position > 80%)
4. Never panic - the model shows $30K+ is now the permanent floor
Key Metrics to Watch
- **Band Position: <20% = Oversold, >80% = Overbought
- Fair Value: Price above = Overvalued, below = Undervalued
- Support Line: Breaking below suggests model invalidation
Current Cycle Projections
Based on the November 2022 bottom at ~$15,500:
- Cycle Peak: ~$155,000-$230,000 (October 2025)
- Next Bottom: ~$70,000-$100,000 (October 2026)
- Long-term: $1 million by 2033 (power law projection)
Customizable Settings
Model Parameters
- Intercept & Slope: Fine-tune the power law formula
- Band Offsets: Adjust support/resistance distances
Display Options
- Toggle each visual element on/off
- Show/hide future projections
- Enable/disable cycle analysis
- Customize halving markers
Understanding the Math
The model uses the formula: **Price = 10^(A + B × log10(days since genesis))**
Where:
- A = -17.01 (intercept)
- B = 5.82 (slope)
- Days counted from Bitcoin's genesis block (Jan 3, 2009)
This creates parallel support/resistance lines in log-log space that have contained Bitcoin's price for 15+ years.
Important
1.Not Financial Advice: This is a mathematical model, not a guarantee
2. Long-term Focus: Best suited for macro analysis, not day trading
3. Model Limitations: Past performance doesn't ensure future results
4. Volatility Expected: 50-80% drawdowns are normal within the model
Background
Dr. Giovanni Santostasi discovered this model while analyzing Bitcoin through the lens of physics. He found that Bitcoin behaves more like a city or organism than a financial asset, growing according to universal power laws found throughout
Open-source script
In true TradingView spirit, the creator of this script has made it open-source, so that traders can review and verify its functionality. Kudos to the author! While you can use it for free, remember that republishing the code is subject to our House Rules.
Disclaimer
The information and publications are not meant to be, and do not constitute, financial, investment, trading, or other types of advice or recommendations supplied or endorsed by TradingView. Read more in the Terms of Use.