OPEN-SOURCE SCRIPT
BBSS+
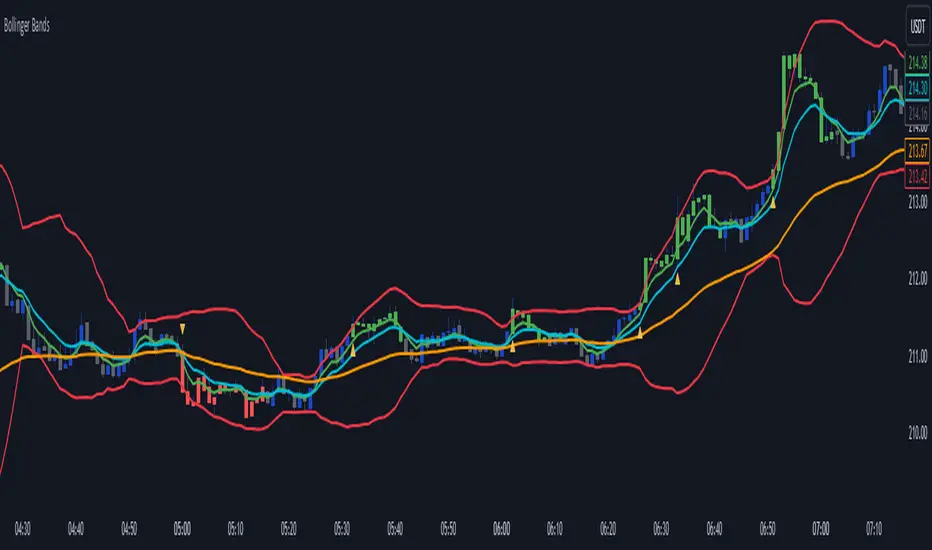
This Pine Script implements a custom indicator overlaying Bollinger Bands with additional features for trend analysis using Exponential Moving Averages (EMAs). Here's a breakdown of its functionality:
Bollinger Bands:
The script calculates the Bollinger Bands using a 20-period Simple Moving Average (SMA) as the basis and a multiplier of 2 for the standard deviation.
It plots the Upper Band and Lower Band in red.
EMA Calculations:
Three EMAs are calculated for the close price with periods of 5, 10, and 40.
The EMAs are plotted in green (5-period), cyan (10-period), and orange (40-period) to distinguish between them.
Trend Detection:
The script determines bullish or bearish EMA alignments:
Bullish Order: EMA 5 > EMA 10 > EMA 40.
Bearish Order: EMA 5 < EMA 10 < EMA 40.
Entry Signals:
Long Entry: Triggered when:
The close price crosses above the Upper Bollinger Band.
The Upper Band is above its 5-period SMA (indicating momentum).
The EMAs are in a bullish order.
Short Entry: Triggered when:
The close price crosses below the Lower Bollinger Band.
The Lower Band is below its 5-period SMA.
The EMAs are in a bearish order.
Trend State Tracking:
A variable tracks whether the market is in a Long or Short trend based on conditions:
A Long trend continues unless conditions for a Short Entry are met or the Upper Band dips below its average.
A Short trend continues unless conditions for a Long Entry are met or the Lower Band rises above its average.
Visual Aids:
Signal Shapes:
Triangle-up shapes indicate Long Entry points below the bar.
Triangle-down shapes indicate Short Entry points above the bar.
Bar Colors:
Green bars indicate a Long trend.
Red bars indicate a Short trend.
This script combines Bollinger Bands with EMA crossovers to generate entry signals and visualize market trends, making it a versatile tool for identifying momentum and trend reversals.
Open-source script
In true TradingView spirit, the creator of this script has made it open-source, so that traders can review and verify its functionality. Kudos to the author! While you can use it for free, remember that republishing the code is subject to our House Rules.
Disclaimer
The information and publications are not meant to be, and do not constitute, financial, investment, trading, or other types of advice or recommendations supplied or endorsed by TradingView. Read more in the Terms of Use.