OPEN-SOURCE SCRIPT
Updated Ultra Market Structure
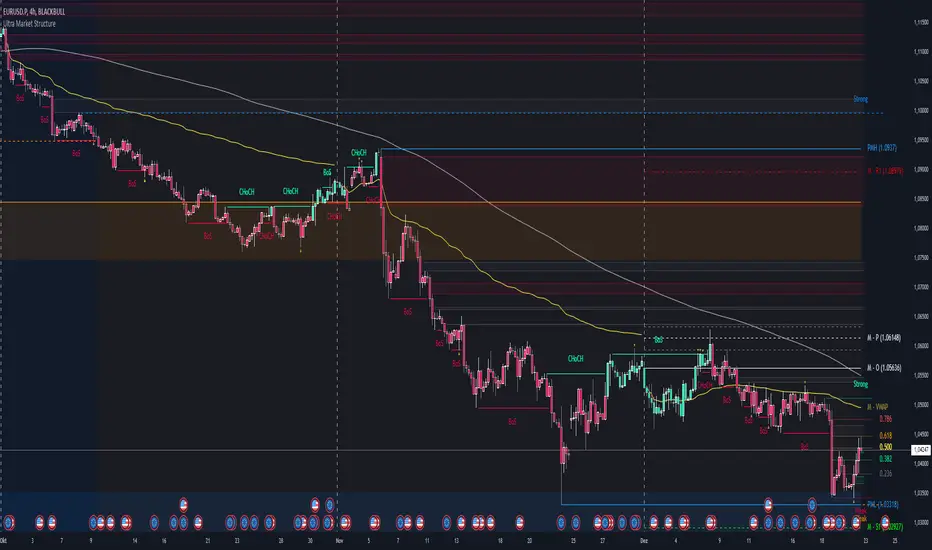
The Ultra Market Structure indicator detects key market structure breaks, such as Break of Structure (BoS) and Change of Character (CHoCH), to help identify trend reversals. It plots lines and labels on the chart to visualize these breakpoints with alerts for important signals.
Introduction
This script is designed to help traders visualize important market structure events, such as trend breaks and reversals, using concepts like Break of Structure (BoS) and Change of Character (CHoCH). The indicator highlights internal and external price levels where the market shifts direction. It offers clear visual signals and alerts to keep traders informed of potential changes in the market trend.
Detailed Description
The indicator focuses on detecting "market structure breaks," which occur when the price moves past significant support or resistance levels, suggesting a potential reversal or continuation of the trend.
.........
.........
Detects Break of Structure (BoS) and Change of Character (CHoCH) signals.
Marks internal and external support/resistance levels where market trends change.
Provides visual cues (lines, labels) and real-time alerts for structure breaks.
Offers background and candle color customization to highlight market direction.
Introduction
This script is designed to help traders visualize important market structure events, such as trend breaks and reversals, using concepts like Break of Structure (BoS) and Change of Character (CHoCH). The indicator highlights internal and external price levels where the market shifts direction. It offers clear visual signals and alerts to keep traders informed of potential changes in the market trend.
Detailed Description
The indicator focuses on detecting "market structure breaks," which occur when the price moves past significant support or resistance levels, suggesting a potential reversal or continuation of the trend.
.........
- Type of structure
Internal Structure: Focuses on smaller, shorter-term price levels within the current market trend.
External Structure: Focuses on larger, longer-term price levels that may indicate more significant shifts in the market.
..... - Key events
Break of Structure (BoS): A market structure break where the price surpasses a previous high (bullish BoS) or low (bearish BoS).
Change of Character (CHoCH): A shift in market behavior when the price fails to continue in the same direction, indicating a possible trend reversal.
Once a break or shift is detected, the script plots lines and labels on the chart to visually mark the breakpoints.
It also provides alerts when a BoS or CHoCH occurs, keeping traders informed in real-time.
The indicator can color the background and candles based on the market structure, making it easy to identify the current trend.
..... - Special feature
At news events or other momentum pushes most structure indicators will go into "sleep mode" because of too far away structure highs/lows. This indicator has a structure reset feature to solve this issue.
.........
Detects Break of Structure (BoS) and Change of Character (CHoCH) signals.
Marks internal and external support/resistance levels where market trends change.
Provides visual cues (lines, labels) and real-time alerts for structure breaks.
Offers background and candle color customization to highlight market direction.
Release Notes
update (added Previous High/Low (Day, Week, Monthadded Fair Value Gap's)
Release Notes
updateadded premium & discount levels
Release Notes
bugfixRelease Notes
update chartbildRelease Notes
added a 2-Candle confirmation for internal structure breaksadded a FVG threshold for too small FVG's
Release Notes
added Auto Fibonacci Retracementthe 2-Candle confirmation feature is working but sometimes it takes the wrong bar to draw from
Release Notes
added customizable Volume-Weighted-Average-Price indicatorsadded candle color tranparency
added some tooltips
Release Notes
added a chaos structure channelsolved minor bugfix of the fib
changed the way premium & discount zones are drawn from, they now drawn from the last overbought/oversold seperatly
Release Notes
added liquidity grabsupdated fib (you can now display both internal and external)
rewrote some parts of the script
Release Notes
update chart pictureRelease Notes
added day/week/month open lineadded day/week/month session divider
changed the whole day/week/month part for quicker settings selection
Release Notes
added a customizable FVG thresholdadded customizable labels
Release Notes
added pivot points and an option to display price at labelsRelease Notes
added pivot points and an option to display price at labelsRelease Notes
added pivot points and an option to display price at labelsRelease Notes
hopefully this will solve the error where x1 argument is too far away!if you encounter this error anyway, please send me a screenshot per private massage with timestamp, timeframe, symbol with data provider and all settings you changed from indicator settings. Thank you!!!
Open-source script
In true TradingView spirit, the creator of this script has made it open-source, so that traders can review and verify its functionality. Kudos to the author! While you can use it for free, remember that republishing the code is subject to our House Rules.
Disclaimer
The information and publications are not meant to be, and do not constitute, financial, investment, trading, or other types of advice or recommendations supplied or endorsed by TradingView. Read more in the Terms of Use.