OPEN-SOURCE SCRIPT
RSI Histogram
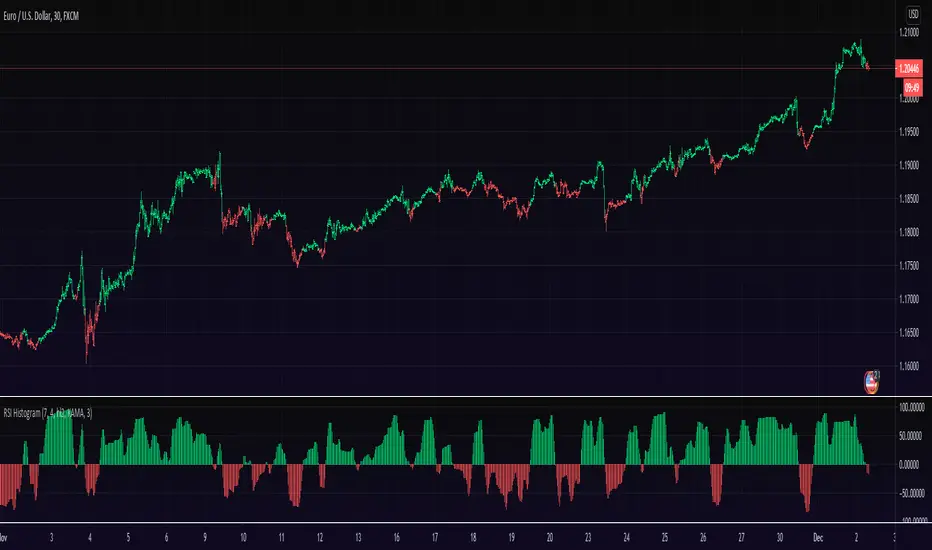
This an experiment to visualise the famous RSI indicator within a Histogram.
Opposed to regular RSI this RSI is plotted into a Histogram and uses different scales (100 to -100), in addition it has the ability to smooth the RSI with various moving averages like HMA, JMA and KAMA.
About RSI:
The RSI measures recent performance of a given stock against its own price history performance, by combining the average gain or loss a particular security owns over a predetermined time period.
Bars can be colored in Settings (Disabled by default)
Enjoy and like if you like :)
Open-source script
In true TradingView spirit, the creator of this script has made it open-source, so that traders can review and verify its functionality. Kudos to the author! While you can use it for free, remember that republishing the code is subject to our House Rules.
Appreciation of my work: paypal.me/dman103
All Premium indicators: algo.win
LIVE Stream - Pivot Points Algo: youtube.com/channel/UCFyqab-i0xb2jf-c18ufH0A/live
All Premium indicators: algo.win
LIVE Stream - Pivot Points Algo: youtube.com/channel/UCFyqab-i0xb2jf-c18ufH0A/live
Disclaimer
The information and publications are not meant to be, and do not constitute, financial, investment, trading, or other types of advice or recommendations supplied or endorsed by TradingView. Read more in the Terms of Use.