OPEN-SOURCE SCRIPT
ATR-Normalized SMA Relative Strength vs Benchmark (20/40/60)
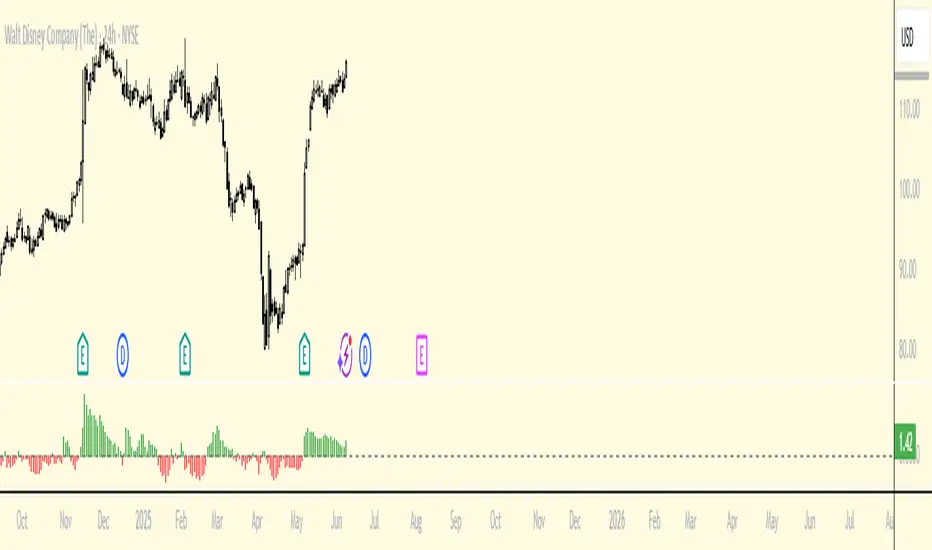
Compares the relative strength of a asset vs the index using SMAs on a 20,40,60 day basis and compares trend strength. Adjusted by ATR to fairly compare assets with varied volatility. All periods are equally weighted at 1/3rd of calculation. Use to identify over/under preforming stock in the S&P500. A measurement of +1 means a stock is 1 ATR above the index, or out preforming by 1 full daily candle range.
Open-source script
In true TradingView spirit, the creator of this script has made it open-source, so that traders can review and verify its functionality. Kudos to the author! While you can use it for free, remember that republishing the code is subject to our House Rules.
Disclaimer
The information and publications are not meant to be, and do not constitute, financial, investment, trading, or other types of advice or recommendations supplied or endorsed by TradingView. Read more in the Terms of Use.