OPEN-SOURCE SCRIPT
VIX Near-Term Futures Curve
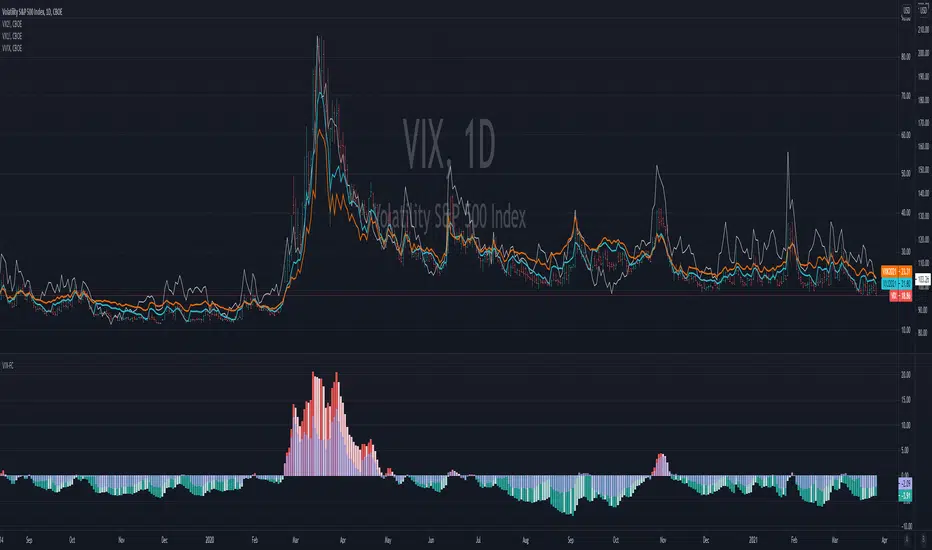
This indicator provides a 3 day smoothed histogram expressing whether the near term VIX futures curve is in a state of contango or backwardation. The solid red/green bars express the spot vs front-month vs next month curve with the value being the cumulative point spread between them. The shaded overlay bars express the spread between the VIX spot index and front-month futures contract only.
This indicator is to be used on a 1 DAY interval or higher.
This indicator is to be used on a 1 DAY interval or higher.
Open-source script
In true TradingView spirit, the creator of this script has made it open-source, so that traders can review and verify its functionality. Kudos to the author! While you can use it for free, remember that republishing the code is subject to our House Rules.
Disclaimer
The information and publications are not meant to be, and do not constitute, financial, investment, trading, or other types of advice or recommendations supplied or endorsed by TradingView. Read more in the Terms of Use.