OPEN-SOURCE SCRIPT
Updated Smart Money Breakout Channels [AlgoAlpha]
🟠OVERVIEW
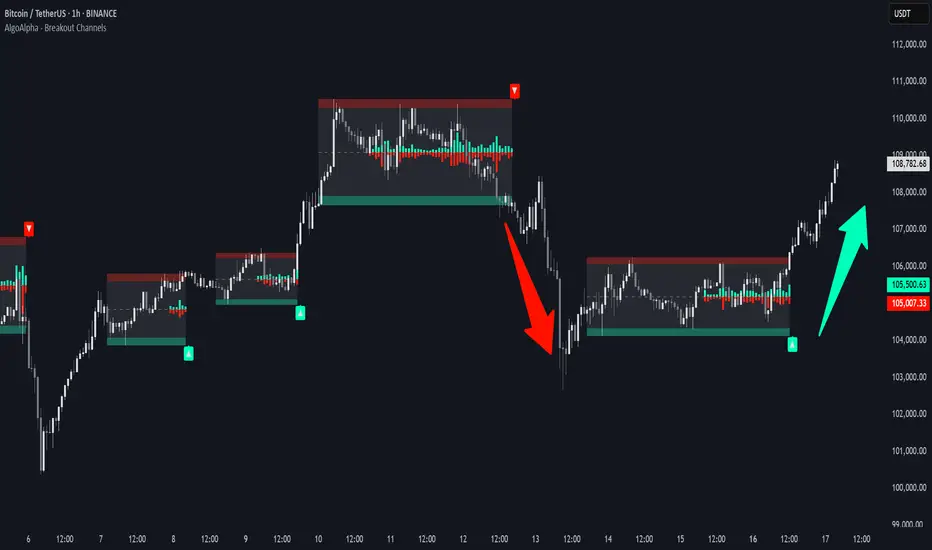
This script draws breakout detection zones called “Smart Money Breakout Channels” based on volatility-normalized price movement and visualizes them as dynamic boxes with volume overlays. It identifies temporary accumulation or distribution ranges using a custom normalized volatility metric and tracks when price breaks out of those zones—either upward or downward. Each channel represents a structured range where smart money may be active, helping traders anticipate key breakouts with added context from volume delta, up/down volume, and a visual gradient gauge for momentum bias.
🟠CONCEPTS
The script calculates normalized price volatility by measuring the standard deviation of price mapped to a [0,1] scale using the highest and lowest prices over a set lookback period. When normalized volatility reaches a local low and flips upward, a boxed channel is drawn between the highest and lowest prices in that zone. These boxes persist until price breaks out, either with a strong candle close (configurable) or by touching the boundary. Volume analysis enhances interpretation by rendering delta bars inside the box, showing volume distribution during the channel. Additionally, a real-time visual “gauge” shows where volume delta sits within the channel range, helping users spot pressure imbalances.
🟠FEATURES
🟠USAGE
Apply the indicator to any chart. Wait for a new breakout box to form—this occurs when volatility behavior shifts and a stable range emerges. Once a box appears, monitor price relative to its boundaries. A breakout above suggests bullish continuation, below suggests bearish continuation; signals are stronger when “Strong Closes Only” is enabled.

Watch the internal volume candles to understand where buy/sell pressure is concentrated during the box. Use the gauge on the right to interpret whether net pressure is building upward or downward before breakout to anticipate the direction.

Use alerts to catch breakout events without needing to monitor the chart constantly 🚨.
This script draws breakout detection zones called “Smart Money Breakout Channels” based on volatility-normalized price movement and visualizes them as dynamic boxes with volume overlays. It identifies temporary accumulation or distribution ranges using a custom normalized volatility metric and tracks when price breaks out of those zones—either upward or downward. Each channel represents a structured range where smart money may be active, helping traders anticipate key breakouts with added context from volume delta, up/down volume, and a visual gradient gauge for momentum bias.
🟠CONCEPTS
The script calculates normalized price volatility by measuring the standard deviation of price mapped to a [0,1] scale using the highest and lowest prices over a set lookback period. When normalized volatility reaches a local low and flips upward, a boxed channel is drawn between the highest and lowest prices in that zone. These boxes persist until price breaks out, either with a strong candle close (configurable) or by touching the boundary. Volume analysis enhances interpretation by rendering delta bars inside the box, showing volume distribution during the channel. Additionally, a real-time visual “gauge” shows where volume delta sits within the channel range, helping users spot pressure imbalances.
🟠FEATURES
- Automatic detection and drawing of breakout channels based on volatility-normalized price pivots.
- Optional nested channels to allow multiple simultaneous zones or a clean single-zone view.
- Gradient-filled volume gauge with dynamic pointer to show current delta pressure within the box.
- Three volume visualization modes: raw volume, comparative up/down volume, and delta.
- Alerts for new channel creation and confirmed bullish or bearish breakouts.
🟠USAGE
Apply the indicator to any chart. Wait for a new breakout box to form—this occurs when volatility behavior shifts and a stable range emerges. Once a box appears, monitor price relative to its boundaries. A breakout above suggests bullish continuation, below suggests bearish continuation; signals are stronger when “Strong Closes Only” is enabled.
Watch the internal volume candles to understand where buy/sell pressure is concentrated during the box. Use the gauge on the right to interpret whether net pressure is building upward or downward before breakout to anticipate the direction.
Use alerts to catch breakout events without needing to monitor the chart constantly 🚨.
Release Notes
Added volume data on channels (right top/bottom corner)Open-source script
In true TradingView spirit, the creator of this script has made it open-source, so that traders can review and verify its functionality. Kudos to the author! While you can use it for free, remember that republishing the code is subject to our House Rules.
🔱Get 50% off ALL PLANS (Code: JULY25)🔱
🚨Get premium: algoalpha.io
🛜Get FREE signals: discord.gg/xCmqTVRexz
❓Do you have feedback or indicator ideas? Join our server to tell us about it!
🚨Get premium: algoalpha.io
🛜Get FREE signals: discord.gg/xCmqTVRexz
❓Do you have feedback or indicator ideas? Join our server to tell us about it!
Disclaimer
The information and publications are not meant to be, and do not constitute, financial, investment, trading, or other types of advice or recommendations supplied or endorsed by TradingView. Read more in the Terms of Use.
Open-source script
In true TradingView spirit, the creator of this script has made it open-source, so that traders can review and verify its functionality. Kudos to the author! While you can use it for free, remember that republishing the code is subject to our House Rules.
🔱Get 50% off ALL PLANS (Code: JULY25)🔱
🚨Get premium: algoalpha.io
🛜Get FREE signals: discord.gg/xCmqTVRexz
❓Do you have feedback or indicator ideas? Join our server to tell us about it!
🚨Get premium: algoalpha.io
🛜Get FREE signals: discord.gg/xCmqTVRexz
❓Do you have feedback or indicator ideas? Join our server to tell us about it!
Disclaimer
The information and publications are not meant to be, and do not constitute, financial, investment, trading, or other types of advice or recommendations supplied or endorsed by TradingView. Read more in the Terms of Use.