OPEN-SOURCE SCRIPT
Updated Flexi MA Reversal
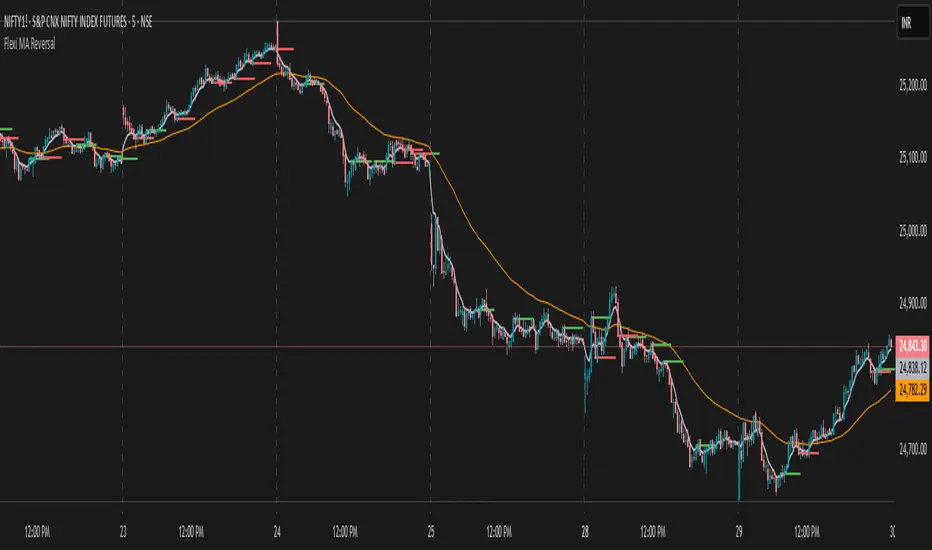
🔹 FlexiMA Reversal – Customizable MA-Based Reversal Indicator
FlexiMA Reversal is a real-time, moving average-based reversal indicator designed to highlight potential market turning points using signal and alert lines. It provides visual cues for both early alerts and confirmed entry signals on candle close.
🔧 Key Features:
Customizable Moving Average Type: Choose from EMA, SMA, WMA, or VWMA (default is EMA).
Flexible MA Inputs: Configure up to three MAs (commonly used 5, 50, and 200).
Toggle Visibility: Enable or disable each MA line as needed.
Real-Time Alert System:
Thin alert lines appear when a potential reversal is detected.
Thicker signal lines confirm the reversal when price closes beyond the alert level.
Optional Visual Styling:
Choose custom colors for each MA, signal, and alert line.
Alert candles are automatically colored to match the corresponding alert line.
Option to show only signal lines for cleaner charts.
Customizable projection length for both alert and signal lines.
📈 Strategy Logic:
This indicator is designed to detect reversal opportunities based on the relationship between price and a selected short-term moving average.
Bullish Setup:
Price closes below the selected MA (e.g., EMA 5).
A bullish alert line is drawn at the high.
If a subsequent candle closes above the alert line and the MA, a bullish signal line is plotted.
Bearish Setup:
Price closes above the selected MA.
A bearish alert line is drawn at the low.
If a subsequent candle closes below the alert line and the MA, a bearish signal line is plotted.
This approach attempts to capture quick market shifts where short-term momentum reverses direction near key MA levels.
🎯 How to Use:
Although originally developed using the 5 EMA strategy, through testing it was found that using 6, 7, or 8 EMA offers even better signal quality.
To add broader trend context, 50 MA and 200 MA lines are included and can be toggled on/off based on your strategy preference.
🔍 Trend Filtering & Re-Entry Tips:
Due to the nature of shorter moving averages, reversal signals may appear frequently. For better trend alignment:
Use the 50 MA as a trend filter:
❌ Ignore bearish signals when price is above 50 MA
❌ Ignore bullish signals when price is below 50 MA
Alternatively, filtered-out signals can be used for re-entry within the trend:
For example, if you receive a bearish alert and signal above the 50 MA, and the next candle closes back above the bearish alert line, this may be interpreted as a bullish re-entry opportunity into the prevailing uptrend.
🛠️ Styling Tips:
You can disable alert candle coloring in the Style tab of the indicator settings.
Use the "Show Only Signal Lines" checkbox to keep the chart minimalistic while still tracking confirmed entries.
Release Notes
The Flexi MA Reversal is a flexible, MA-driven signal indicator designed to detect potential reversal points based on price behavior around a user-defined short-term moving average (MA1). It visually highlights early alert zones and confirmed entry signals for both bullish and bearish reversal opportunities.This version includes significant display enhancements and usability upgrades, making it easier for traders to:
Customize moving average types and lengths
Focus on clean signals by hiding alerts or showing both as needed
Control line visibility and chart clutter
Avoid distractions by disabling alert candle coloring by default
🔷 What’s New / Improvements
This updated version includes:
✅ Line Display Mode Selector
A dropdown to choose between:
• Signal Only (default)
• Alert Only
• Both Signal & Alert lines
✅ Bar Coloring Toggle
Bar coloring for alert candles is now optional and disabled by default to reduce chart noise.
✅ Default MA Visibility Optimized
Only MA1 and MA2 are visible by default for a cleaner view. MA3 is optional and can be enabled as needed.
✅ Polished and Stable Logic
Signal and Alert lines are plotted only when confirmed by price action
Alerts are cancelled automatically when invalidated by touching MA1
No repainting — all signals are based on confirmed candle closes
🔷 How It Works
🔹 Bullish Setup
Bullish Alert: Price closes below MA1 and the high is also below MA1 → a potential long setup is forming.
Bullish Signal: Price closes above the alert high and MA1 → a confirmed long signal.
🔹 Bearish Setup
Bearish Alert: Price closes above MA1 and the low is also above MA1 → potential short setup forming.
Bearish Signal: Price closes below the alert low and MA1 → confirmed short signal.
Lines are drawn horizontally to represent signal/alert levels, and are automatically cleaned up when invalidated.
Open-source script
In true TradingView spirit, the creator of this script has made it open-source, so that traders can review and verify its functionality. Kudos to the author! While you can use it for free, remember that republishing the code is subject to our House Rules.
Disclaimer
The information and publications are not meant to be, and do not constitute, financial, investment, trading, or other types of advice or recommendations supplied or endorsed by TradingView. Read more in the Terms of Use.