OPEN-SOURCE SCRIPT
Updated Fibonacci Pivot Levels [UkutaLabs]
█ OVERVIEW
The Fibonacci Pivot Levels Indicator provides real-time insight into key price levels within the market that can serve as powerful support and resistance levels. These levels are based on currently-relevant price-action information as well as key Fibonacci ratios to ensure that the lines being drawn provide the most value to traders regardless of their trading style.
The Fibonacci levels are a powerful form of technical analysis that allows traders to predict future potential price support and resistance levels.
The aim of this script is to simplify the trading experience of users by automatically identifying and displaying price levels that they should be aware of.
█ USAGE
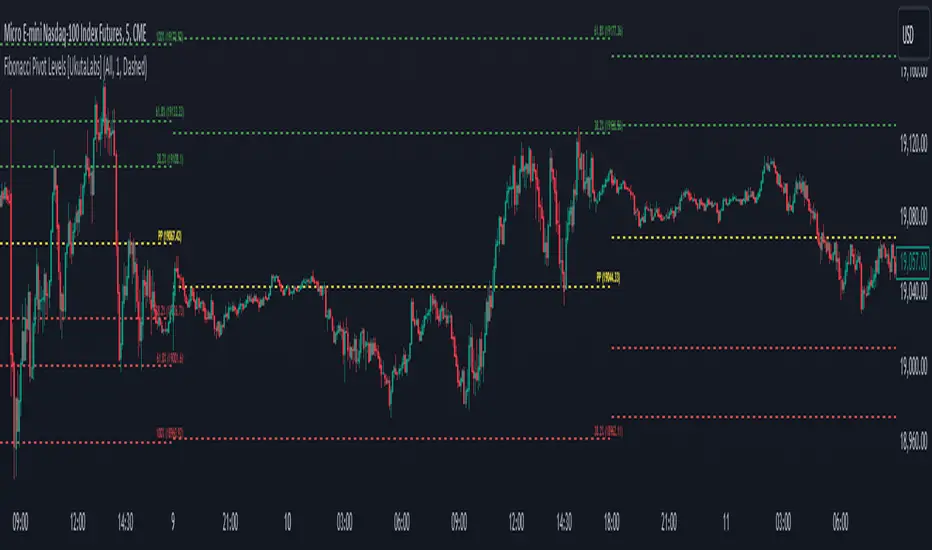
At the beginning of each trading day, the script will identify the previous day’s hlc3 level. We refer to this level as the day’s Source Level, and it is from this price that the other Resistance and Support levels are calculated.
The script then identifies the total price range of the previous day (Previous Day High - Previous Day Low), then incrementally draws lines at a distance of the previous day’s range multiplied by key Fibonacci ratios from the Source Level.
The script identifies these levels on both sides of the Source. Levels above the Source are considered to be points of Resistance and below the Source are considered to be Support, but the levels are free to be interpreted and used in whatever way fits the user’s trading strategy.
A label is drawn at the end of each line that displays the Fibonacci ratio that was used to calculate it as well as the price that the line represents. These labels can be disabled in the settings.
█ SETTINGS
Configuration
• Display Mode: Determines how many days the script will draw lines for.
• Show Labels: Determines whether or not labels are drawn at the end of each line.
Line Colors
• Resistance Color: Determines the color of Resistance Lines drawn above the Source.
• Source Color: Determines the color of the Source Line.
• Support Color: Determines the color of Support Lines drawn below the Source.
Line Settings
• Line Width: Determines the width of all lines.
• Line Style: Determines the style of all lines.
The Fibonacci Pivot Levels Indicator provides real-time insight into key price levels within the market that can serve as powerful support and resistance levels. These levels are based on currently-relevant price-action information as well as key Fibonacci ratios to ensure that the lines being drawn provide the most value to traders regardless of their trading style.
The Fibonacci levels are a powerful form of technical analysis that allows traders to predict future potential price support and resistance levels.
The aim of this script is to simplify the trading experience of users by automatically identifying and displaying price levels that they should be aware of.
█ USAGE
At the beginning of each trading day, the script will identify the previous day’s hlc3 level. We refer to this level as the day’s Source Level, and it is from this price that the other Resistance and Support levels are calculated.
The script then identifies the total price range of the previous day (Previous Day High - Previous Day Low), then incrementally draws lines at a distance of the previous day’s range multiplied by key Fibonacci ratios from the Source Level.
The script identifies these levels on both sides of the Source. Levels above the Source are considered to be points of Resistance and below the Source are considered to be Support, but the levels are free to be interpreted and used in whatever way fits the user’s trading strategy.
A label is drawn at the end of each line that displays the Fibonacci ratio that was used to calculate it as well as the price that the line represents. These labels can be disabled in the settings.
█ SETTINGS
Configuration
• Display Mode: Determines how many days the script will draw lines for.
• Show Labels: Determines whether or not labels are drawn at the end of each line.
Line Colors
• Resistance Color: Determines the color of Resistance Lines drawn above the Source.
• Source Color: Determines the color of the Source Line.
• Support Color: Determines the color of Support Lines drawn below the Source.
Line Settings
• Line Width: Determines the width of all lines.
• Line Style: Determines the style of all lines.
Release Notes
-Updated script to prevent lines from being drawn ahead of current bar.Release Notes
• Added a new Setting: Font Size. This setting allows the user to determine the font size of labels.Release Notes
•Added three new Fibonacci Levels: 23.6%, 50% and 76.4%Release Notes
- Added ability to change text alignment.- Changed default load period to one day.
Open-source script
In true TradingView spirit, the creator of this script has made it open-source, so that traders can review and verify its functionality. Kudos to the author! While you can use it for free, remember that republishing the code is subject to our House Rules.
Disclaimer
The information and publications are not meant to be, and do not constitute, financial, investment, trading, or other types of advice or recommendations supplied or endorsed by TradingView. Read more in the Terms of Use.