OPEN-SOURCE SCRIPT
Divergence Indicator with Multi-Length Pivot Detection
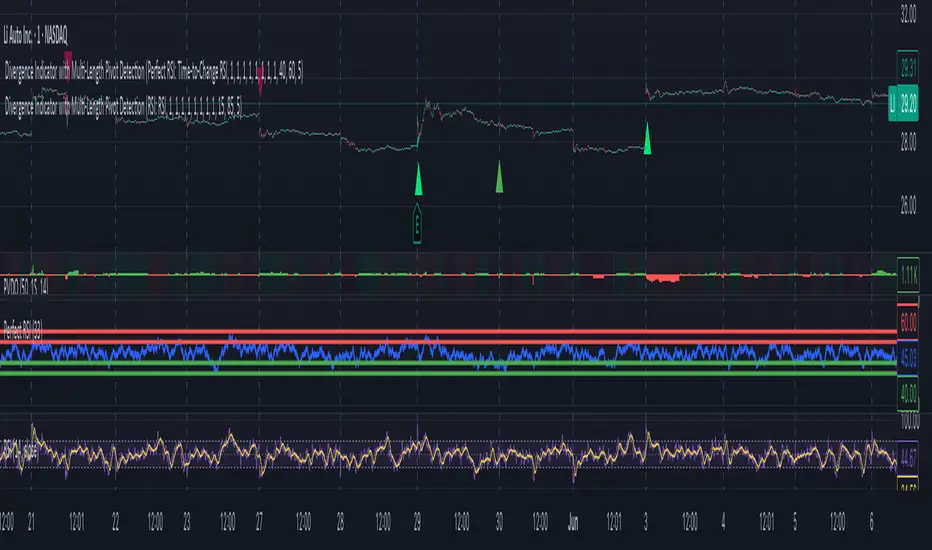
This Pine Script, titled “Divergence Indicator with Multi-Length Pivot Detection”, tool that detects both regular and hidden divergences between price action and an oscillator (defaulting to close, but configurable). It features multi-length pivot logic, angle-based validation, no-cross filtering, and OB/OS region filtering, making it a robust and precise divergence engine. Below is a detailed breakdown:
⸻
🔧 Inputs and Configuration
• osc_src: Oscillator source (e.g. close, RSI, MACD).
• show_hidden: Toggles detection of hidden divergences.
• min_*_angle settings: Control the minimum angle thresholds (in degrees) for confirming valid divergences (ensures momentum is strong enough).
• validate_no_cross: Ensures oscillator and price slopes don’t “cross” the actual values (i.e. filters out invalid or messy trends).
• oversold_level, overbought_level: Used when use_ob_os_filter is enabled to require oscillator to be in OS/OB zones for regular divergence.
• min_div_length: Minimum distance in bars between previous and current pivot points.
⸻
🔁 Internal Engine Mechanics
1. Pivot Detection Engine (Phase 1: Historical Memory)
• For all combinations of left1 and right1 in the range [1, 10]:
• Records all valid pivot lows and pivot highs.
• Stores their:
• bar index
• price value
• oscillator value
This forms a “memory buffer” of past pivots that future price pivots are compared against.
2. Current Pivot Detection (Phase 2: Scanning)
• Loops through larger pivot configurations (left2 ∈ [5,15], right2 = 1) to detect new current pivots.
• For each new pivot, it compares against the historical pivots from phase 1.
⸻
📐 Slope and Angle Calculation
For each matching pivot pair (historical vs current):
• Price and Oscillator Slopes are calculated via linear regression, producing:
• price_angle
• osc_angle
• These are converted using math.atan() and math.todegrees() to get proper angular direction and intensity of trend.
⸻
🧠 Divergence Logic
✅ Bullish Divergence
• Regular Bullish: Price makes a lower low, oscillator makes a higher low.
• Hidden Bullish: Price makes a higher low, oscillator makes a lower low.
• Conditions:
• Must meet minimum angle thresholds.
• Optional: Must be in oversold region (osc_src < oversold_level).
• If validate_no_cross is enabled, linearly interpolated slope must not be violated.
✅ Bearish Divergence
• Regular Bearish: Price makes a higher high, oscillator makes a lower high.
• Hidden Bearish: Price makes a lower high, oscillator makes a higher high.
• Conditions mirror the bullish case (with polarity reversed).
⸻
🖍️ Visualization
• Draws colored lines between pivots for visual clarity:
• Green: Regular Bullish
• Lime: Hidden Bullish
• Red: Regular Bearish
• Maroon: Hidden Bearish
• Uses plotshape() to mark divergence bars:
• Triangle-up for bullish
• Triangle-down for bearish
The lines and shapes help quickly identify divergence zones with strong momentum structure.
⸻
🧪 Filtering Enhancements
• No Cross Slope Filter: Checks that oscillator and price values stay above/below their respective slope lines throughout the interval.
• OB/OS Filter: Restricts divergence signals to occur only in oversold/overbought conditions for regular divergences.
• Signal Thinning: Keeps line count to 100 using array.shift() and line.delete().
⸻
🧬 Design Philosophy
• Built to mimic institutional-grade divergence detection, avoiding common false positives.
• Uses adaptive pivots, rigorous angle validation, and noise filtering.
⸻
🔧 Inputs and Configuration
• osc_src: Oscillator source (e.g. close, RSI, MACD).
• show_hidden: Toggles detection of hidden divergences.
• min_*_angle settings: Control the minimum angle thresholds (in degrees) for confirming valid divergences (ensures momentum is strong enough).
• validate_no_cross: Ensures oscillator and price slopes don’t “cross” the actual values (i.e. filters out invalid or messy trends).
• oversold_level, overbought_level: Used when use_ob_os_filter is enabled to require oscillator to be in OS/OB zones for regular divergence.
• min_div_length: Minimum distance in bars between previous and current pivot points.
⸻
🔁 Internal Engine Mechanics
1. Pivot Detection Engine (Phase 1: Historical Memory)
• For all combinations of left1 and right1 in the range [1, 10]:
• Records all valid pivot lows and pivot highs.
• Stores their:
• bar index
• price value
• oscillator value
This forms a “memory buffer” of past pivots that future price pivots are compared against.
2. Current Pivot Detection (Phase 2: Scanning)
• Loops through larger pivot configurations (left2 ∈ [5,15], right2 = 1) to detect new current pivots.
• For each new pivot, it compares against the historical pivots from phase 1.
⸻
📐 Slope and Angle Calculation
For each matching pivot pair (historical vs current):
• Price and Oscillator Slopes are calculated via linear regression, producing:
• price_angle
• osc_angle
• These are converted using math.atan() and math.todegrees() to get proper angular direction and intensity of trend.
⸻
🧠 Divergence Logic
✅ Bullish Divergence
• Regular Bullish: Price makes a lower low, oscillator makes a higher low.
• Hidden Bullish: Price makes a higher low, oscillator makes a lower low.
• Conditions:
• Must meet minimum angle thresholds.
• Optional: Must be in oversold region (osc_src < oversold_level).
• If validate_no_cross is enabled, linearly interpolated slope must not be violated.
✅ Bearish Divergence
• Regular Bearish: Price makes a higher high, oscillator makes a lower high.
• Hidden Bearish: Price makes a lower high, oscillator makes a higher high.
• Conditions mirror the bullish case (with polarity reversed).
⸻
🖍️ Visualization
• Draws colored lines between pivots for visual clarity:
• Green: Regular Bullish
• Lime: Hidden Bullish
• Red: Regular Bearish
• Maroon: Hidden Bearish
• Uses plotshape() to mark divergence bars:
• Triangle-up for bullish
• Triangle-down for bearish
The lines and shapes help quickly identify divergence zones with strong momentum structure.
⸻
🧪 Filtering Enhancements
• No Cross Slope Filter: Checks that oscillator and price values stay above/below their respective slope lines throughout the interval.
• OB/OS Filter: Restricts divergence signals to occur only in oversold/overbought conditions for regular divergences.
• Signal Thinning: Keeps line count to 100 using array.shift() and line.delete().
⸻
🧬 Design Philosophy
• Built to mimic institutional-grade divergence detection, avoiding common false positives.
• Uses adaptive pivots, rigorous angle validation, and noise filtering.
Open-source script
In true TradingView spirit, the creator of this script has made it open-source, so that traders can review and verify its functionality. Kudos to the author! While you can use it for free, remember that republishing the code is subject to our House Rules.
Disclaimer
The information and publications are not meant to be, and do not constitute, financial, investment, trading, or other types of advice or recommendations supplied or endorsed by TradingView. Read more in the Terms of Use.