OPEN-SOURCE SCRIPT
HSRL - historical support resistance lines
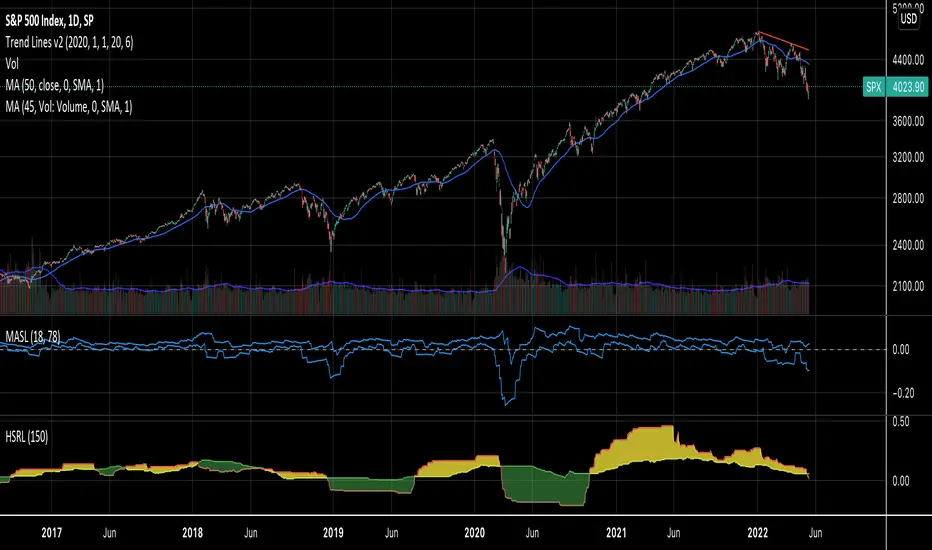
HSRL provides an indicator of how support and resistance are changing over time. It calculates the percent change in lows, and percent change in highs, then plots them. The HSRL is calculated as the support change - the resistance change. Can be effective in confirming trends, with green being the most bullish, yellow being semi bullish and red being a bearish indicator, where resistance and support are falling.
Open-source script
In true TradingView spirit, the creator of this script has made it open-source, so that traders can review and verify its functionality. Kudos to the author! While you can use it for free, remember that republishing the code is subject to our House Rules.
Disclaimer
The information and publications are not meant to be, and do not constitute, financial, investment, trading, or other types of advice or recommendations supplied or endorsed by TradingView. Read more in the Terms of Use.