OPEN-SOURCE SCRIPT
3% Above and Below Previous Day Close (Stable)
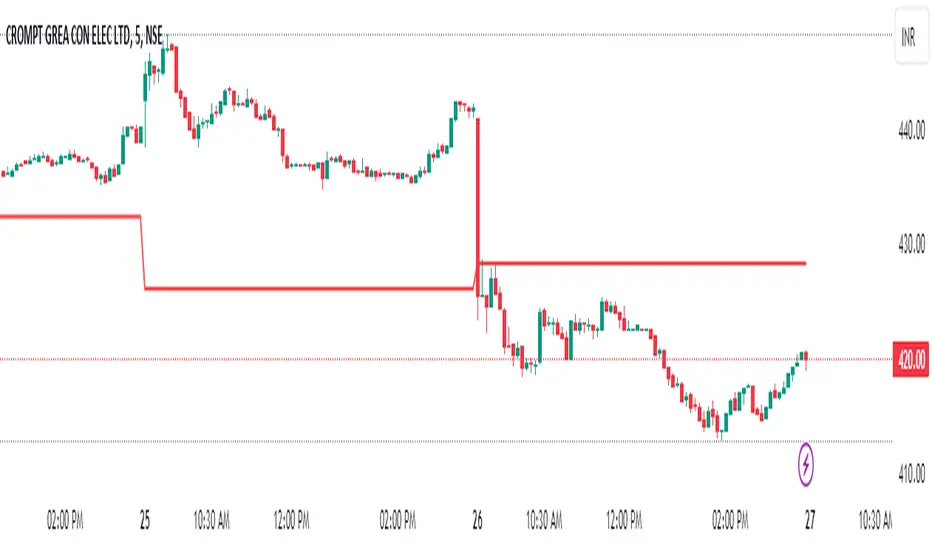
This indictor will mark intraday levels. Levels will be marked by calculating 3% up and 3% down from previous day close.
This indicator calculates 3% levels above and below the previous day's close. These levels can be used to track potential support or resistance levels throughout the trading day.
This script helps plot 3% above and below the previous day's close price. It allows you to toggle historical levels and can be useful for monitoring potential intraday price action around these key levels.
Open-source script
In true TradingView spirit, the creator of this script has made it open-source, so that traders can review and verify its functionality. Kudos to the author! While you can use it for free, remember that republishing the code is subject to our House Rules.
Disclaimer
The information and publications are not meant to be, and do not constitute, financial, investment, trading, or other types of advice or recommendations supplied or endorsed by TradingView. Read more in the Terms of Use.