OPEN-SOURCE SCRIPT
Fair Value Gap Chart
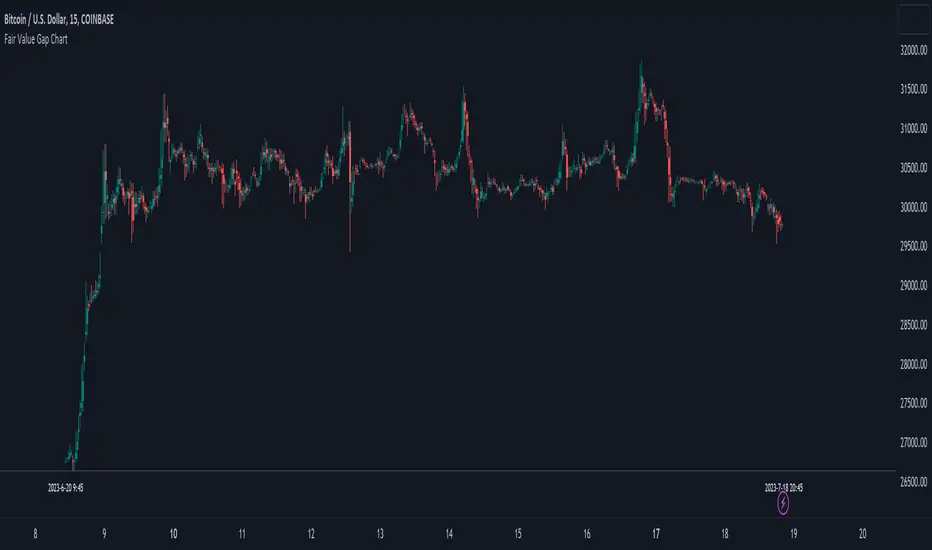
The Fair Value Gap chart is a new charting method that displays fair value gap imbalances as Japanese candlesticks, allowing traders to quickly see the evolution of historical market imbalances.
The script is additionally able to compute an exponential moving average using the imbalances as input.
🔶 USAGE

The Fair Value Gap chart allows us to quickly display historical fair value gap imbalances. This also allows for filtering out potential noisy variations, showing more compact trends.

Most like other charting methods, we can draw trendlines/patterns from the displayed results, this can be helpful to potentially predict future imbalances locations.
Users can display an exponential moving average computed from the detected fvg's imbalances. Imbalances above the ema can be indicative of an uptrend, while imbalances under the ema are indicative of a downtrend.
Note that due to pinescript limitations a maximum of 500 lines can be displayed, as such displaying the EMA prevent candle wicks from being displayed.
🔶 DETAILS
🔹Candle Structure

The Fair Value Gap Chart is constructed by keeping a record of all detected fair value gaps on the chart. Each fvg is displayed as a candlestick, with the imbalance range representing the body of the candle, and the range of the imbalance interval being used for the wicks.
🔹EMA Source Input
The exponential moving average uses the imbalance range to get its input source, the extremity of the range used depends on whether the fvg is bullish or bearish.
When the fvg is bullish, the maximum of the imbalance range is used as ema input, else the minimum of the fvg imbalance is used.
The script is additionally able to compute an exponential moving average using the imbalances as input.
🔶 USAGE
The Fair Value Gap chart allows us to quickly display historical fair value gap imbalances. This also allows for filtering out potential noisy variations, showing more compact trends.
Most like other charting methods, we can draw trendlines/patterns from the displayed results, this can be helpful to potentially predict future imbalances locations.
Users can display an exponential moving average computed from the detected fvg's imbalances. Imbalances above the ema can be indicative of an uptrend, while imbalances under the ema are indicative of a downtrend.
Note that due to pinescript limitations a maximum of 500 lines can be displayed, as such displaying the EMA prevent candle wicks from being displayed.
🔶 DETAILS
🔹Candle Structure
The Fair Value Gap Chart is constructed by keeping a record of all detected fair value gaps on the chart. Each fvg is displayed as a candlestick, with the imbalance range representing the body of the candle, and the range of the imbalance interval being used for the wicks.
🔹EMA Source Input
The exponential moving average uses the imbalance range to get its input source, the extremity of the range used depends on whether the fvg is bullish or bearish.
When the fvg is bullish, the maximum of the imbalance range is used as ema input, else the minimum of the fvg imbalance is used.
Open-source script
In true TradingView spirit, the creator of this script has made it open-source, so that traders can review and verify its functionality. Kudos to the author! While you can use it for free, remember that republishing the code is subject to our House Rules.
Check out the indicators we are making at luxalgo: tradingview.com/u/LuxAlgo/
"My heart is so loud that I can't hear the fireworks"
"My heart is so loud that I can't hear the fireworks"
Disclaimer
The information and publications are not meant to be, and do not constitute, financial, investment, trading, or other types of advice or recommendations supplied or endorsed by TradingView. Read more in the Terms of Use.