OPEN-SOURCE SCRIPT
Updated Price Change History
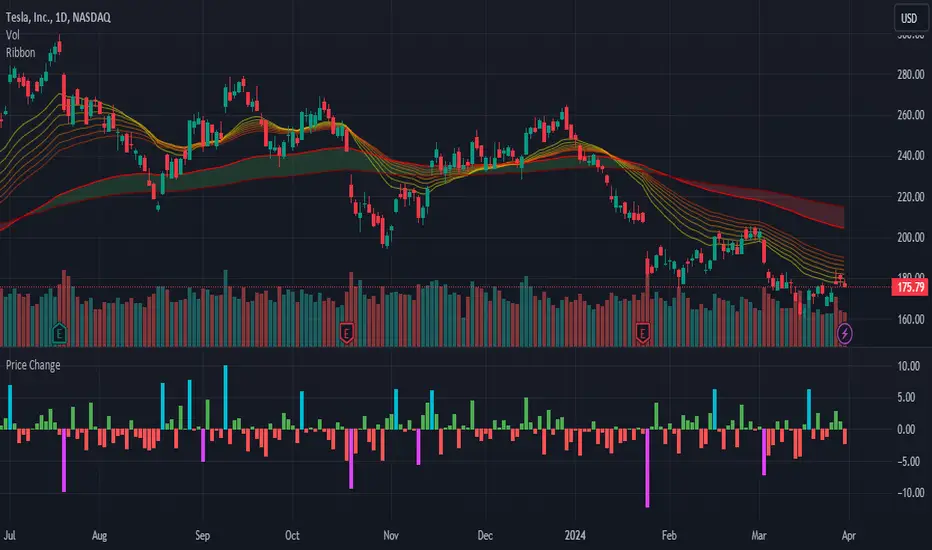
Display a histogram of price changes over a given interval. Show change as a percentage or in dollar amount. Highlight changes that exceed a particular value.
Release Notes
By default, the histogram shows price change since the previous bar. This update allows you to display price change since any number of bars ago.Release Notes
Separate high and low highlighting.Release Notes
Update study shorttitle.Release Notes
The ratio of highlighted to unhighlighted bars is now shown as the orange number ranging from 0 to 1.It takes into consideration the previous 50 bars by default, but can be changed by the user under settings.
Release Notes
- Updated the names of a few settings to be clearer as to what they do.- Included some documentation in the source code to explain each setting.
Release Notes
- Add default precision
- Improve comments
Release Notes
Updated to Pine Script v4Release Notes
- Update to Pine Script v5- Additional comments
- Code cleanup
Open-source script
In true TradingView spirit, the creator of this script has made it open-source, so that traders can review and verify its functionality. Kudos to the author! While you can use it for free, remember that republishing the code is subject to our House Rules.
Disclaimer
The information and publications are not meant to be, and do not constitute, financial, investment, trading, or other types of advice or recommendations supplied or endorsed by TradingView. Read more in the Terms of Use.